SCADA-System Benutzerhandbuch
DAQ for IIoT — Data Acquisition System (English)

| [Shanghai Data Acquisition IOT Technology Co., LTD.]Data Acquisition System User Manual |
|---|
| Version: V 2.1 |
| department | Product Department | Classification | Internal disclosure |
|---|---|---|---|
| Document No. | Written by | ||
| Creation Date | 2022 | Last Updated | 2022.04 |
System Overview
Functional Overview
AIIOT general industrial data acquisition system is a set of equipment data acquisition and management software running on edge computers. It is mainly used for data collection, control, storage, query, display and upload of various instruments and equipment (PLC, injection molding machines, CNC machine tools, electric meters, flow meters, etc.).
The main functions of the system include:
- Flexible transport configuration (link, storage, device, factor, upload service)
- Data collection and upload
- Real-time monitoring (device, upload)
- Alarm configuration and monitoring
- Data storage and query (tables, charts, Web API)
- Configuration and visualization
- User and permission management
- Interface multi-language support
Operating Environment
| project | Require |
|---|---|
| operating system | Windows, Linux |
| Software Basic Environment | .NET 6 |
| Client browser | Edge, Chrome, Firefox, Safari, Opera, etc. |
| Collection system access address | http://localhost:16801/scada.html |
| Configure the visualization access address | http://localhost:16804/diagram.html |
Supported devices
Support communication links
Some of the communication links supported by the system include:
| Link Type | Communication Link |
|---|---|
| TCP | TCP Client |
| TCP Server | |
| Serial Port | Serial UART |
| UDP | UDP |
| HTTP | HTTP Server |
| HTTP Client | |
| OPC | OPC-UA |
| OPC-DA | |
| MQTT | MQTT-TCP |
| MQTT-WebSocket |
Supported communication protocols
Some of the communication protocols supported by the system include:
| Protocol Type | Master Agreement | Sub-protocol |
|---|---|---|
| PLC Communication Protocol | Modbus | Modbus-RTU |
| Modbus-TCP | ||
| Modbus-ASCII | ||
| Siemens S7 | ||
| Mitsubishi MELSEC communication protocol | MELSEC-1E | |
| MELSEC-3C | ||
| MELSEC-3E | ||
| MELSEC-4C | ||
| MELSEC-4D | ||
| Mitsubishi- Fx | ||
| OPC Communication Protocol | OPC-UA | |
| OPC-DA | ||
| MQTT communication protocol | MQTT-JSON | |
| Energy meter communication protocol | DL/T645 | |
| DLMS | DLMS-LN | |
| DLMS-SN | ||
| IEC62056-21 | ||
| Edmi Command-Line | ||
| IEC Communication Protocol | IEC103 | |
| IEC104 | ||
| Environmental Monitoring Communication Protocol | HJ212 | |
| SL651 | ||
| SZY206 |
Glossary
equipment
The system collects data from a device that has a communication interface and uses a specific communication protocol to communicate. The device can be a detection instrument, a small meter, a sensor, or even a separate PLC.
factor
Factors are attributes of a device, including its measured value, state, control unit, etc. For example, for a measuring instrument, the following attributes can be called a factor:
- Latest measured value (measured value)
- Current device status: measuring, standby, fault, etc. (status)
- Start measurement, stop measurement (control unit)
link
The physical connection method between the system and the device and the basic communication protocol, that is, the part below the link layer in the communication process. For example, it can be using a serial communication line and a UART communication protocol; or using a network cable and a TCP/IP communication protocol. It supports multiple devices sharing one link.
drive
A functional module that implements functions such as collection, upload, and storage. According to the functional division, it includes collection driver (implementing collection communication protocol parsing), upload driver (implementing upload communication protocol parsing), link driver (implementing the connection and data transmission and reception of specific links), and storage driver (implementing the storage and operation of specific databases).
Upload Service
The system uploads data to the platform or other devices using specific links and communication protocols.
Upload Factor
The factor to be uploaded to the platform or other device.
Service Concept
Our company solemnly promises:
You buy not only the product, but also the meticulous and thoughtful technical support service ! ! ! ( =^_^= )
For most of our wireless products, ordinary workers are needed to connect the power and install them on site! No debugging is required!
We provide free remote guidance, remote configuration and debugging services, and send data to the user's designated cloud platform. (Hardware)
Free IoT solution consulting services!
Software Installation and Authentication
Installation on 64-bit Windows
Environment Preparation
Before installing the system, please make sure that .NET6 has been successfully installed. You can download and install .NET6 from the Microsoft official website .
| https://download.visualstudio.microsoft.com/download/pr/9b8baa92-04f4-4b1a-8ccd-aa6bf31592bc/3a25c73326e060e04c119264ba58d0d5/dotnet-sdk-6.0.418-win-x64.exe |
|---|
If you are using an older Windows system, you may need to install the following prerequisite packages first (if you are prompted during the installation process that the service cannot be started, this generally means that you need to install the prerequisite packages):
Essential Package 1:
| https://download.visualstudio.microsoft.com/download/pr/b929b7fe-5c89-4553-9abe-6324631dcc3a/296F96CD102250636BCD23AB6E6CF70935337B1BBB3507FE8521D8D9CFAA932F/VC_redist.x64.exe |
|---|
Essential Pack 2:
| https://download.microsoft.com/download/0/8/E/08E0386B-F6AF-4651-8D1B-C0A95D2731F0/Windows6.1-KB3063858-x64.msu |
|---|
Software Installation
After downloading the installation package, run the installation program, as shown below:
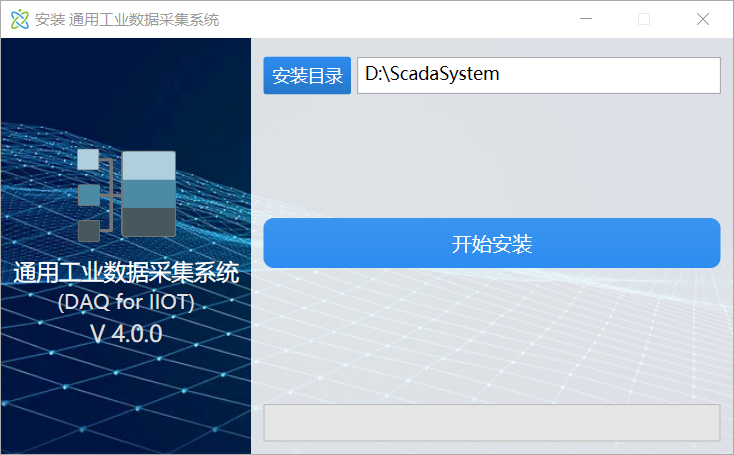
Select the installation directory and click the Start Installation button to complete the system installation.
Open the management page
After the system is installed, you can use a modern browser (Edge or Chrome is recommended) and enter http://localhost:16801/scada.html in the address bar to access the management page. Since the system requires login, you will first enter the login page:
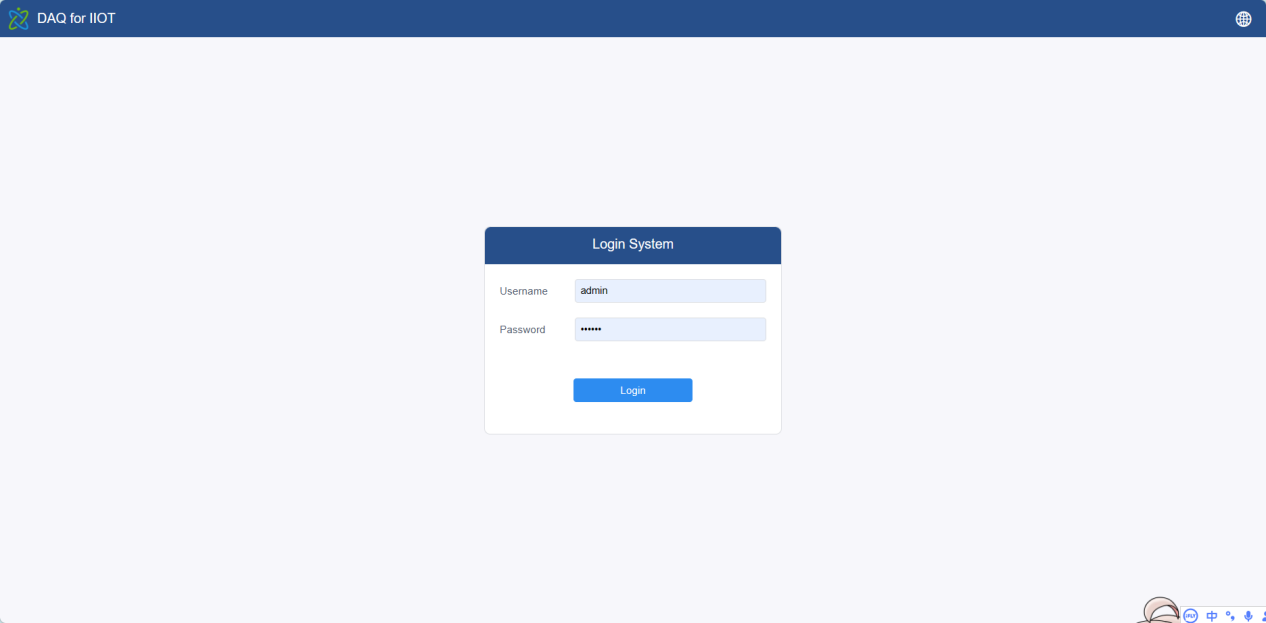
The default system accounts are:
| account | password | illustrate |
|---|---|---|
| admin | 123456 | No user management privileges |
| super | 123456 | Full permissions |
After logging in, you can enter the system homepage, as shown below:
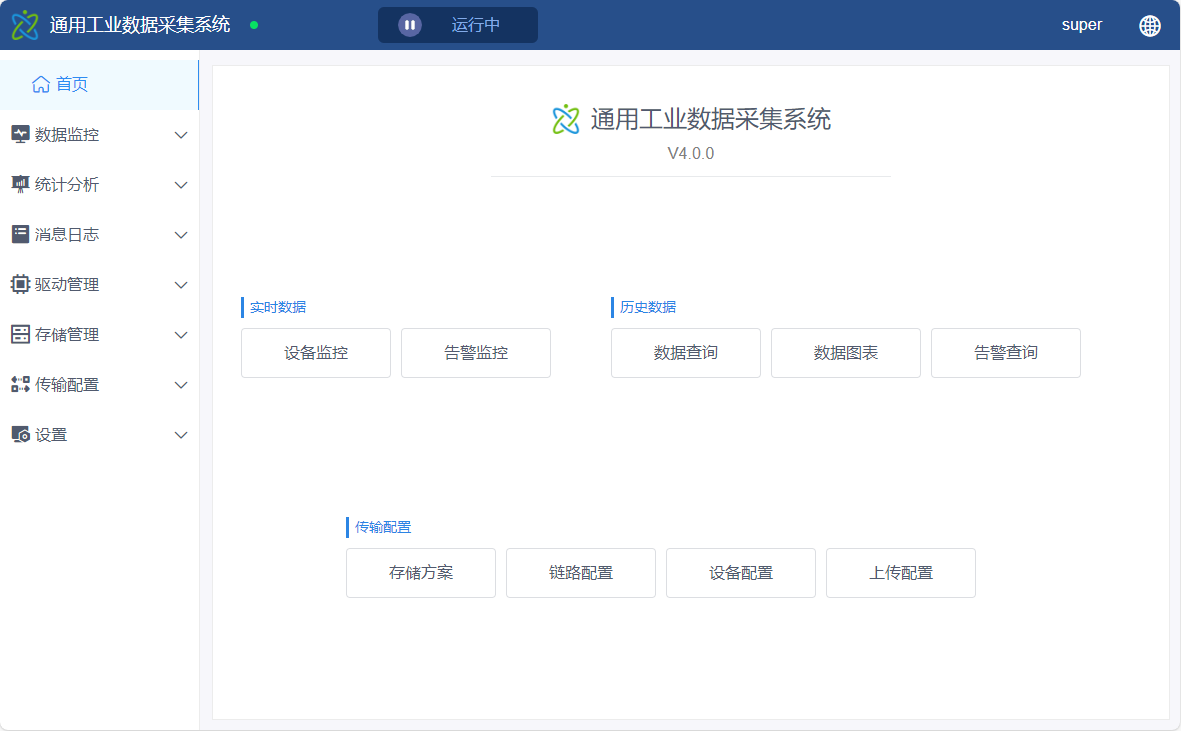
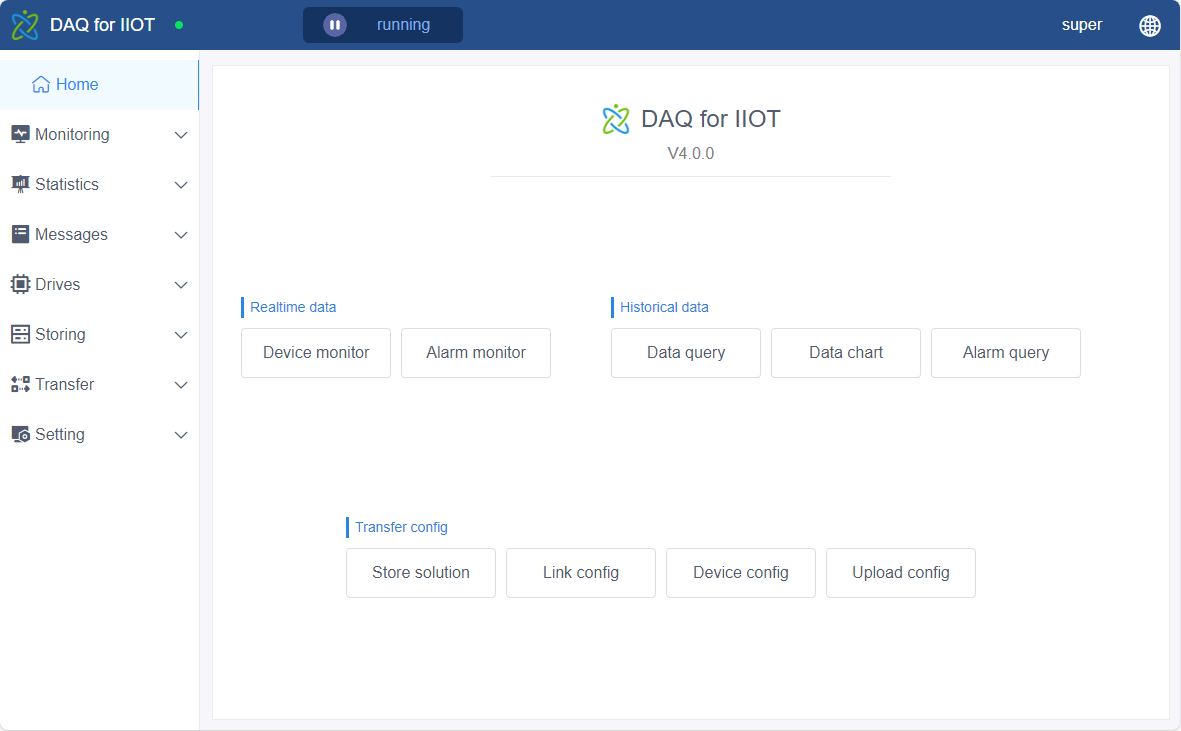
If necessary, the system can switch the interface language freely. The following figure is the English interface:
System Certification
The system has a 14-day trial period. After the trial period, the system needs to be authenticated before it can be used normally (otherwise the system cannot collect data). The authentication operation is completed on the system configuration page (Settings->System Configuration):
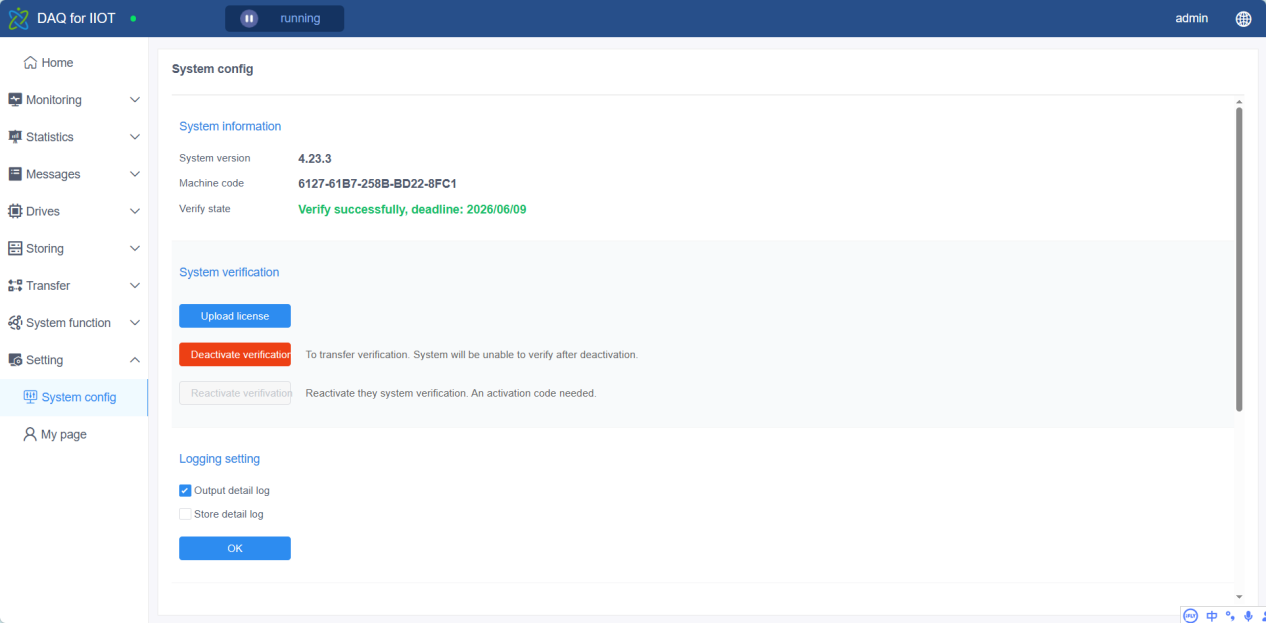
The certification process is:
- Copy the machine code and provide it to the supplier.
- Obtain certification documents from suppliers.
- Upload the authentication document.
It should be noted that one authentication file can only authenticate one computer.
Transfer and storage configuration
Transport Architecture
for collection, uploading and storage is shown below:
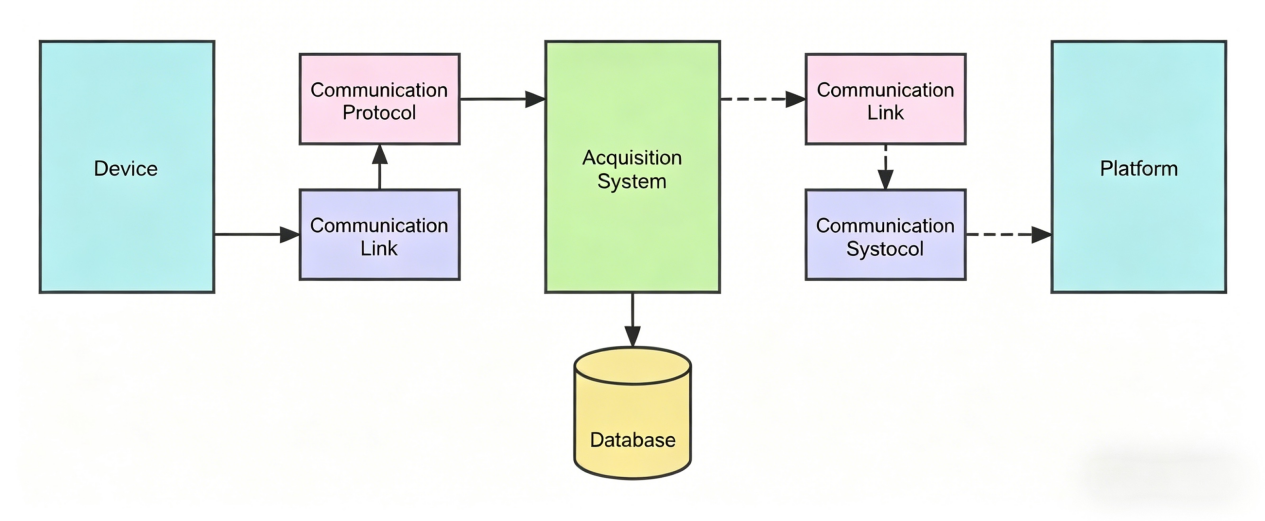
Generally speaking, the core function of the system is to collect data from the device, store the data, and upload it to the platform. Each transmission requires the use of a communication link and a certain communication protocol. Then, the entire transmission and storage process will have the following modules:
- Communication Link
- Collection Protocol
- Upload Agreement
- Storage Solutions
For each module, the system adopts a driver + configuration model to meet the needs. Taking the storage solution as an example, the storage driver contains the code to store data in a certain database (such as MySQL), while the storage configuration includes the connection string and when to store these contents.
Driver Management
The driver is a code library that implements specific functions and can be imported into the system as needed. The following is the management page of the acquisition driver:
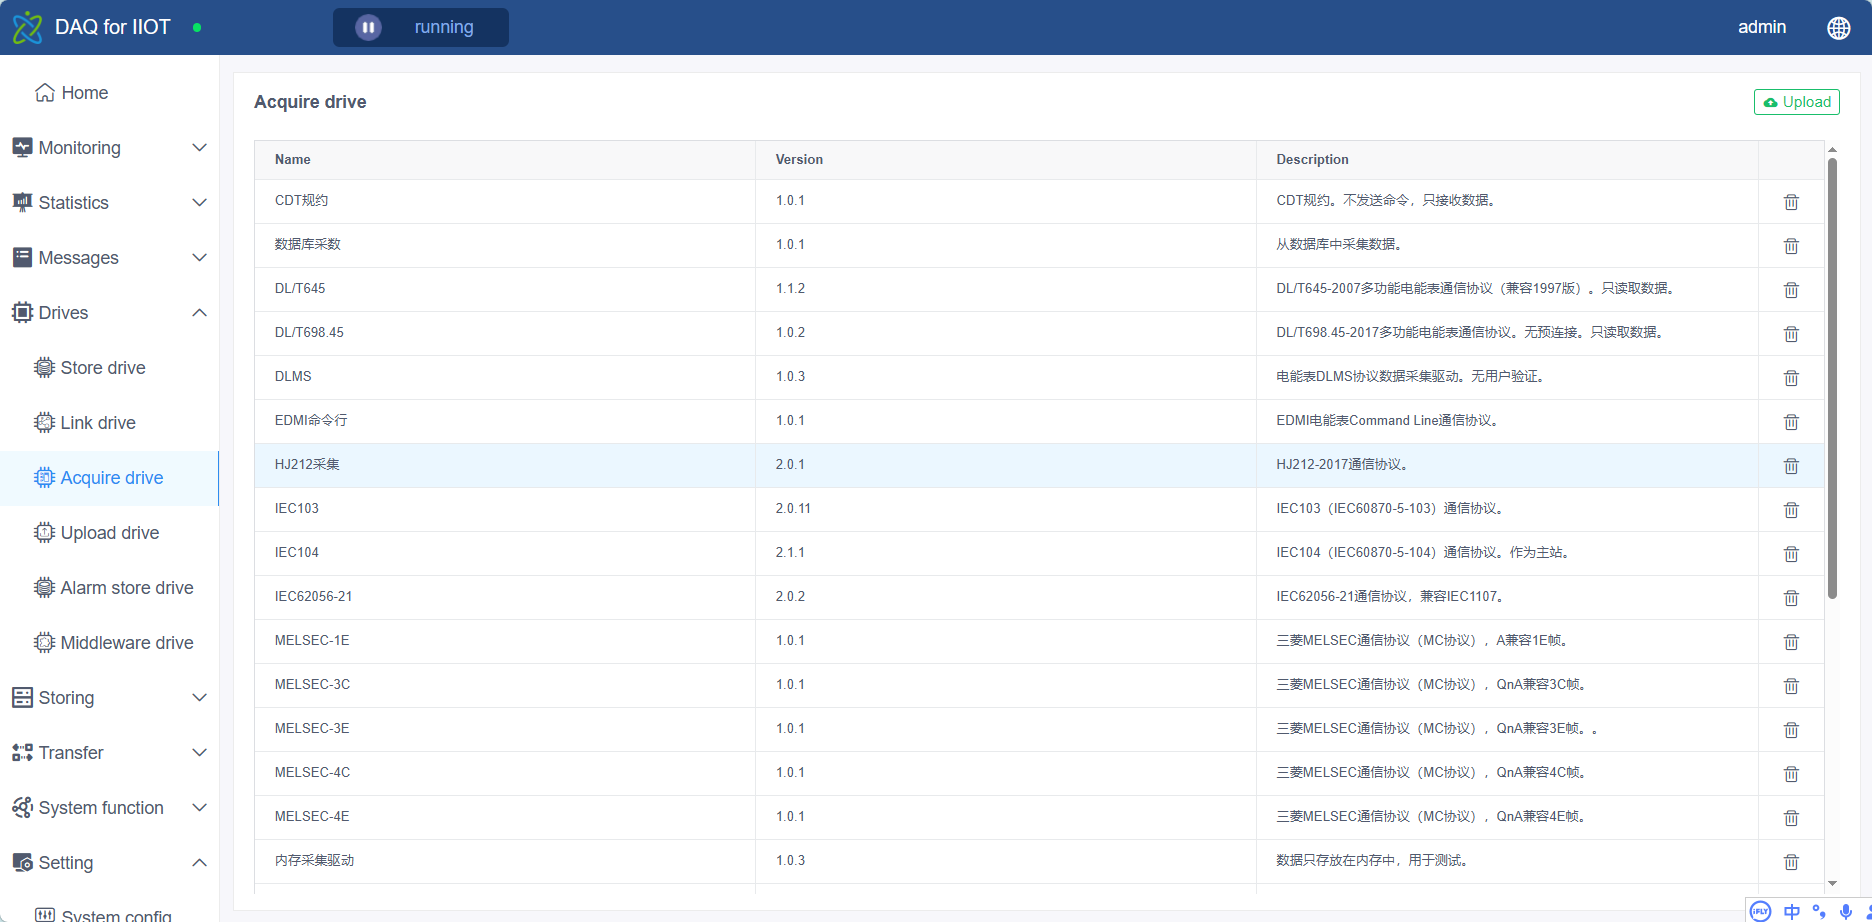
Generally, you can obtain the driver from the supplier, upload it to the system, and use it after configuration. For specific application scenarios, you can also develop the driver yourself according to the development documentation.
Data collection configuration
Data collection requires configuration of storage solutions, communication links, and communication protocols.
Storage Solutions
Each device can select a different storage solution (or all devices can select the same storage solution). The storage solution management page (Storage Management->Storage Solution) is shown below:
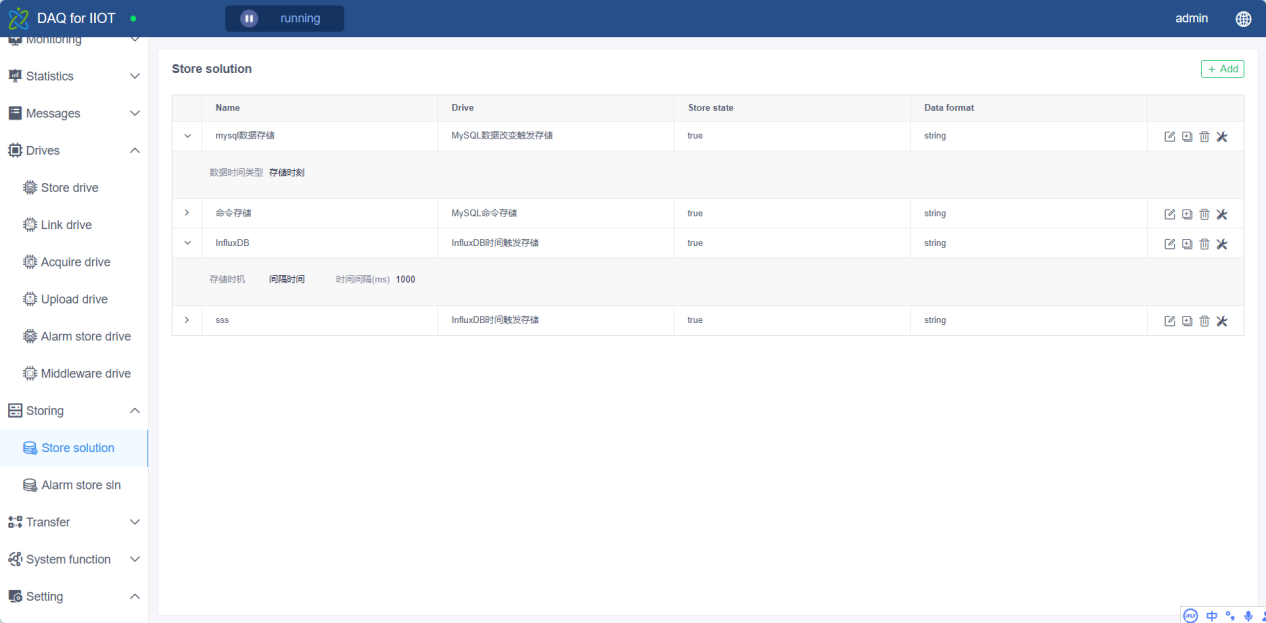
In the storage plan, you can select the type of database to be stored, the storage time, whether to store the status, the data format, etc.
Supported databases
The system supports databases such as SQLite, SQL Server, and MySQL.
Connection String
For SQLite database, fill in the file path in the connection string, such as:
| D:\db\mydb.db |
|---|
The typical connection string format for SQL Server is:
| Data Source=MY-COMPUTER\ SQLEXPRESS;Initial Catalog= mydb;User Id= sa;Password =password; |
|---|
The typical connection string format for MySQL is:
| User ID= root;Password =password;Host=localhost;Port=3306;Database=mydb; |
|---|
Storage time
There are two types of storage timing: interval time and specified time.
The interval time needs to be filled in with a time in milliseconds . The data will be stored once every time this interval is reached . For example, if you fill in 60000, it will be stored once a minute.
The format for specifying time is: ` HH:mm HH:mm HH:mm `, only hours and minutes are supported. Data will be stored once at the specified time of each day. For example, if you enter `08:00 12:00 16:00 `, data will be stored once at 8:00, 12:00, and 16:00.
Data Format
Data formats include strings and numbers. If all data collected by the system are numbers, it is recommended to use the number format, which can save space and improve performance. If the data includes non-numeric strings, you can only choose the string format.
Storage Status
checking the storage status, the database will store the current status of the device while storing the data. When the device is offline, the collected data will still be the value collected last time. For specific values of the device status, see Appendix 1.
Database maintenance
When the transmission configuration is modified, the database structure will be modified accordingly. In order to clean up redundant structures and data, the system provides three maintenance operations:
Clean the table structure: clear unused columns and unused tables.
Clear data: Clear all data.
Rebuild table structure: Clear the old structure and data and recreate the table structure.
Link Configuration
The link configuration page (Transmission Configuration->Link Configuration) is shown below:
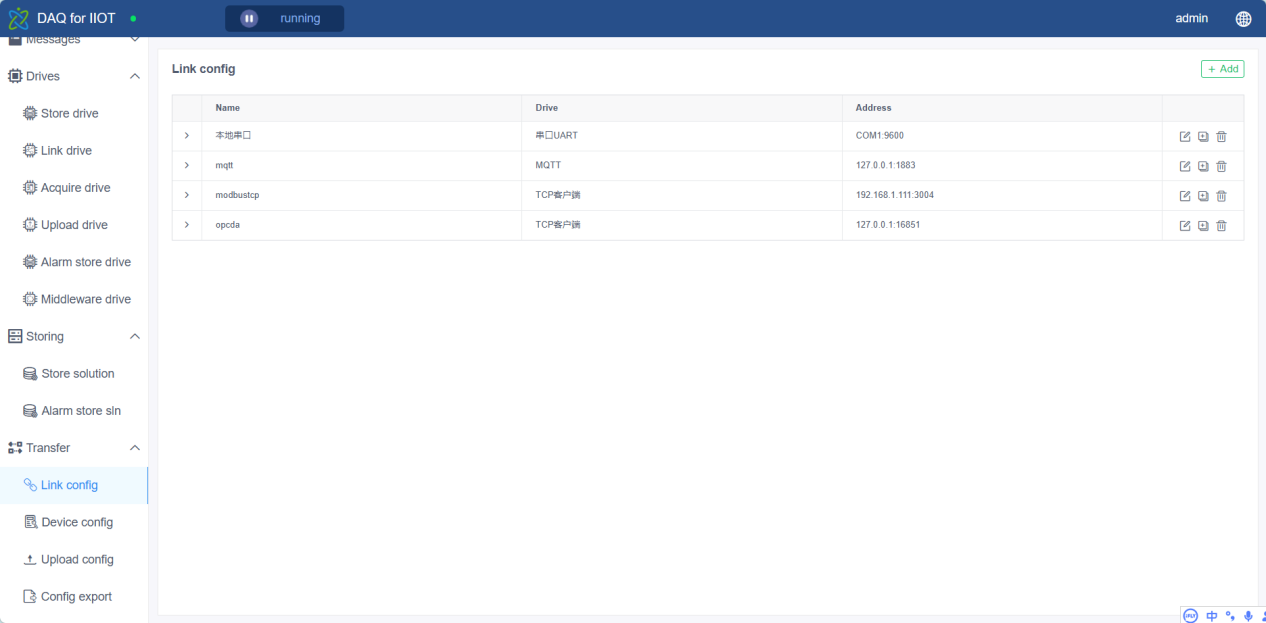
The currently supported link types and the contents that need to be configured are shown in the following table:
| Link Type | Contents to be configured |
|---|---|
| TCP Client | Server IP, server port, connection timeout, disconnection reconnection interval |
| Serial UART | Serial port number, baud rate, parity bit, data bit, stop bit |
| TCP Server | Server IP, Server port |
| UDP | Remote IP, Remote Port, Local IP, Local Port |
| OPC-UA | Service URL, certificate directory, certificate subject, user name, password |
| MQTT | Basic protocol, MQTT host, MQTT port, user name, password, subscription topic |
| HTTP Client | URL |
| HTTP Server | IP address, port |
Device Configuration
Device Configuration
Device configuration is mainly about the configuration of communication protocol. The device configuration page (Transmission Configuration->Device Configuration) is shown in the figure below:
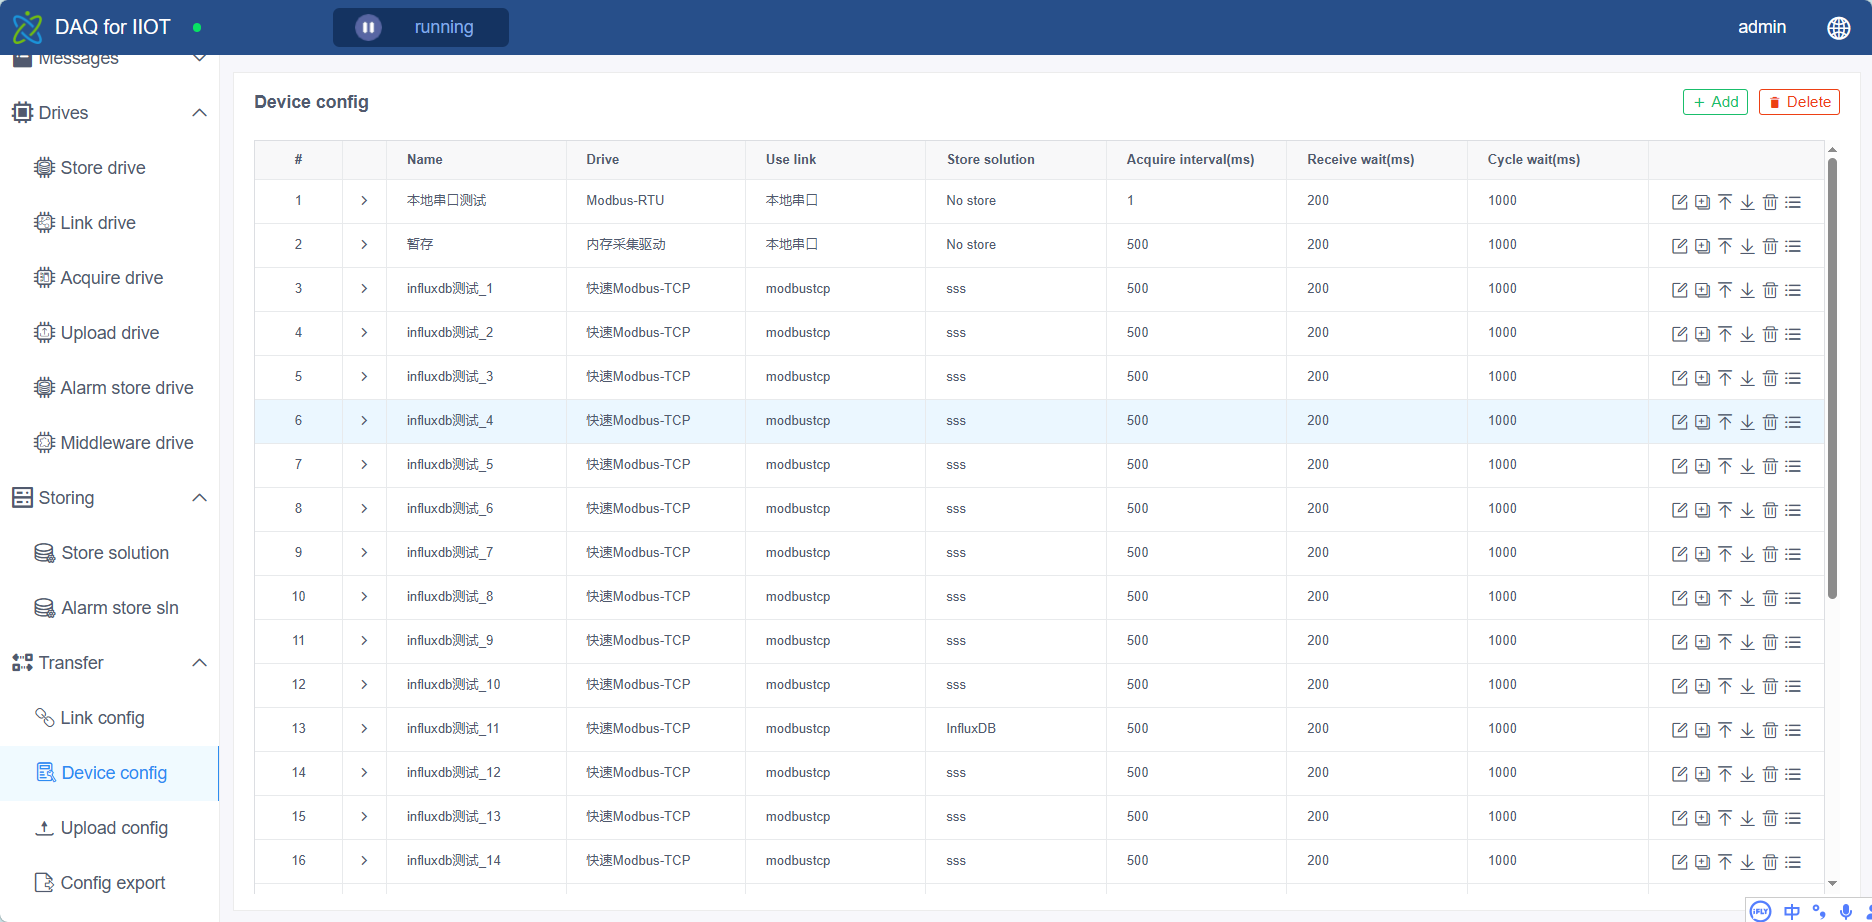
Devices using different drivers will have different configuration information. However, all devices need to configure certain information, as shown in the following table:
| Configuration Content | illustrate |
|---|---|
| Using the driver | The driver used by the device. You can select the driver added in the acquisition driver page. |
| Use Link | The link used by the device. The link added in the link configuration page is optional. |
| Storage Solutions | The storage solution used by the device. You can add storage solutions on the optional storage solution page. |
| Collection interval | The frequency at which the terminal sends commands to the device when collecting data . The unit is milliseconds. |
| Receiving Waiting | the terminal sends a command to the device , the expected time for the device to respond normally. The unit is milliseconds. |
| Cycle Wait | The waiting time for the next instruction cycle after one instruction cycle ends. The unit is milliseconds. |
Factor configuration
The device contains factors (devices without added factors generally do not collect data). The factor configuration page (from the device configuration page, click the button on the far right of a device to enter) is shown in the figure below:
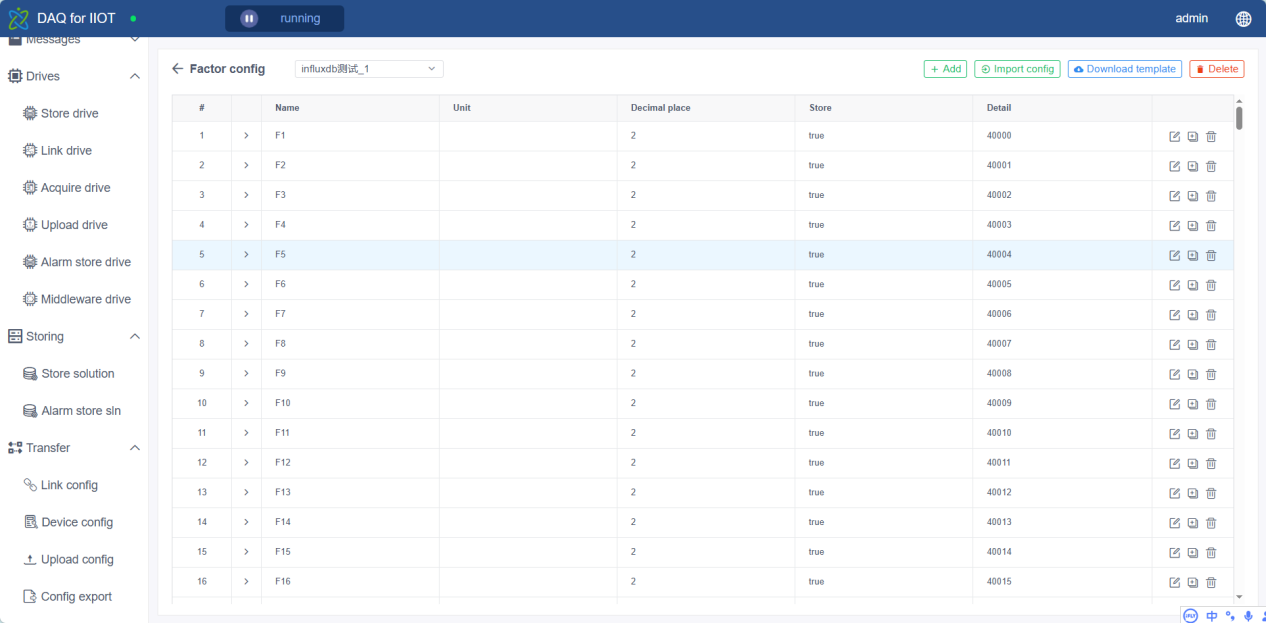
Devices using different drivers require different information to be configured. Several common properties are described below:
| Configuration Content | illustrate |
|---|---|
| unit | Data unit. |
| Decimal Places | The number of decimal places when displaying data. If it is -1, the original value is used. The data in the database ignores this configuration. |
| Whether to store | Only when this is checked will the data be stored in the database. |
| expression | The data are calculated and transformed as described in Appendix 2. |
Data upload configuration
Data upload requires configuration of communication link and communication protocol. The configuration of communication link is the same as that of data collection.
upload service configuration page (Transfer Configuration -> Upload Configuration) is shown in the figure below:
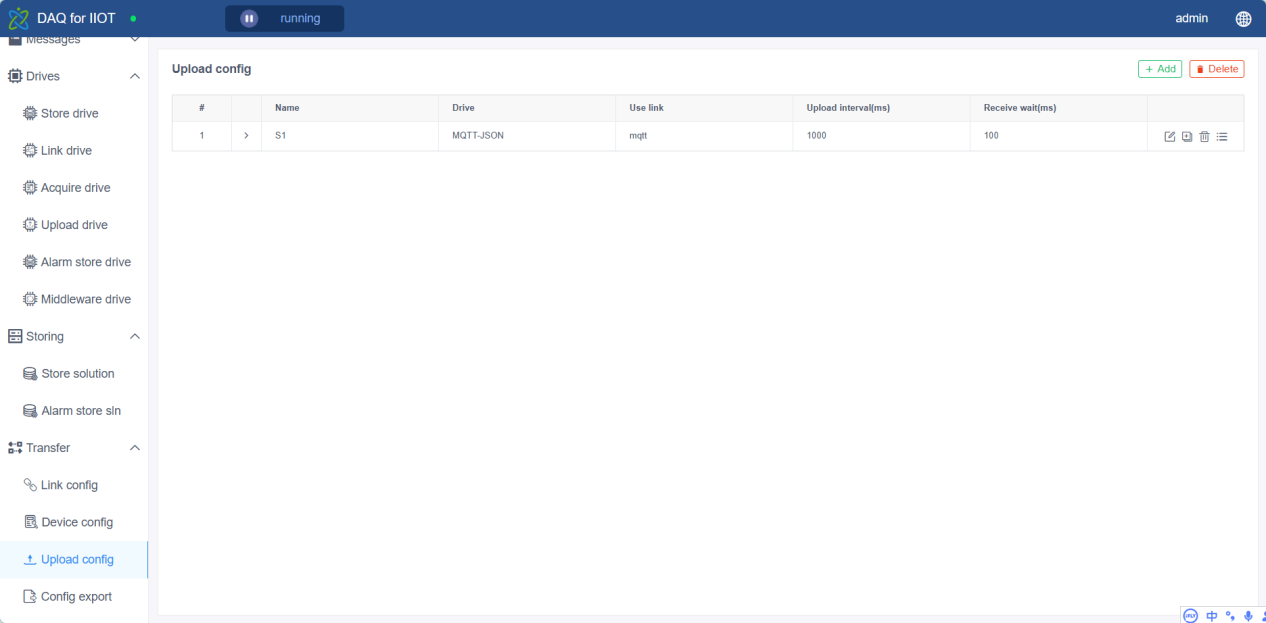
the upload service, you need to configure the upload factor. You can configure it on the upload factor configuration page (from the upload configuration page, click the button on the far right of an upload service to enter), as shown in the following figure:
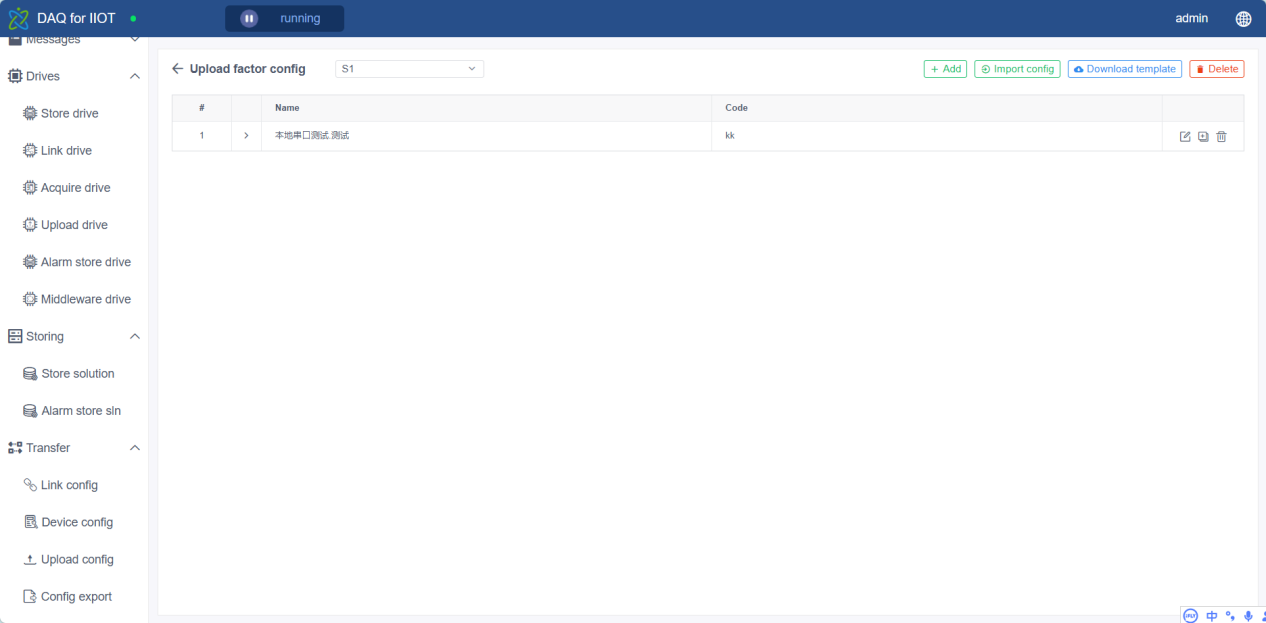
The configuration content varies according to the protocol. The following are the common properties of each upload factor:
coding
For most upload protocols, if you fill in the field, the data will be uploaded with the code. If you do not fill in the field, the data will be uploaded with the original name of the factor. For example, for the MQTT upload protocol, if the factor is device1.factor1, if you do not fill in the field, the topic of the upload is data/device1.factor1; if you fill in the field code1, the topic of the upload is data/code1.
Configuration import and export
Configuration Export
Export the configuration in the Configuration Export page (Transfer Configuration -> Configuration Export), as shown in the following figure:
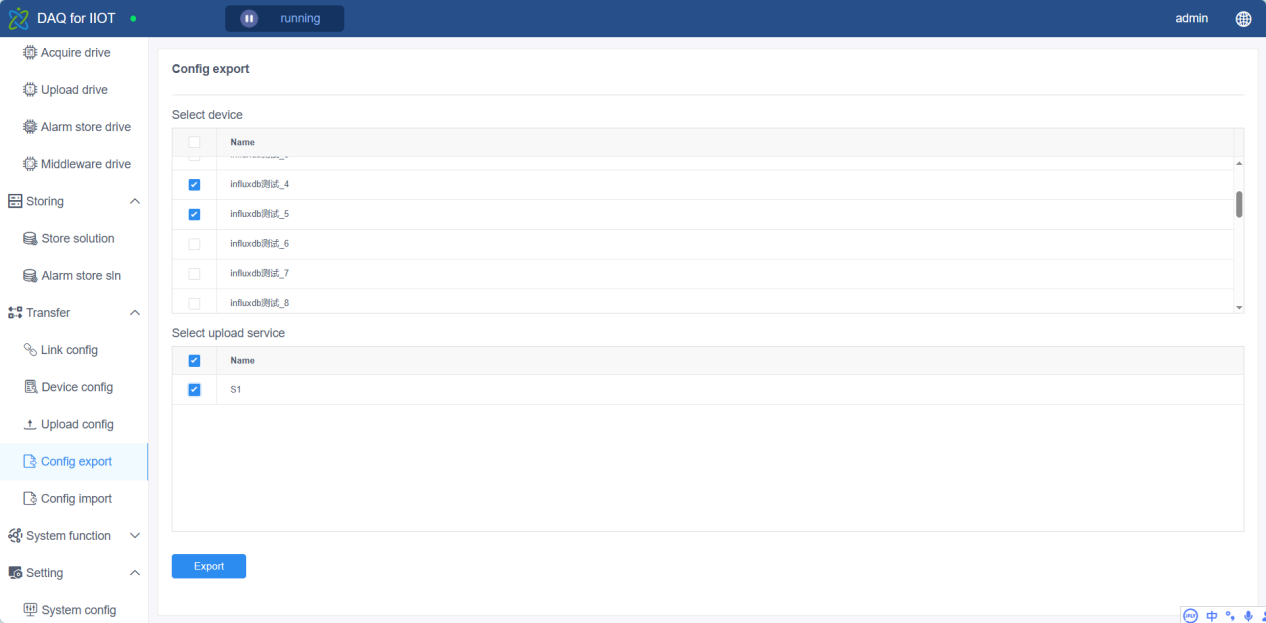
During the export process, you need to select the device to be exported and the upload service. When exporting, the related link configuration and storage solution will be exported at the same time.
Configuration Import
Import the configuration in the Configuration Import page (Transfer Configuration -> Configuration Import), as shown below:
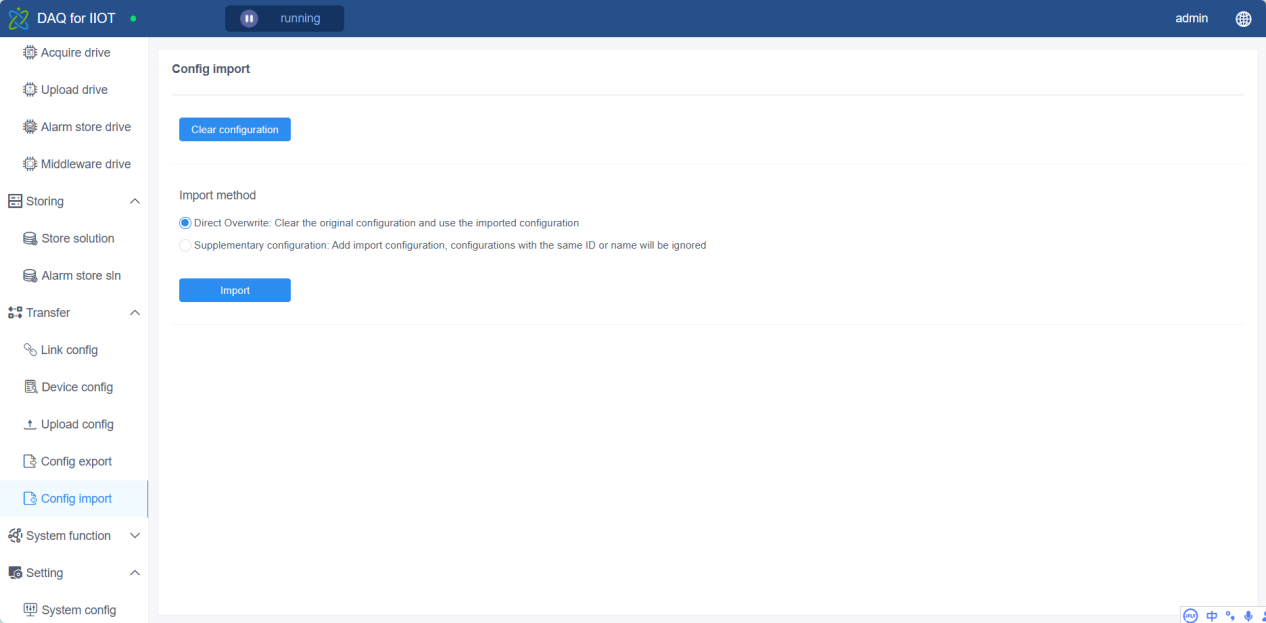
When importing configuration, you can choose from the following options based on actual conditions:
Clear configuration: Clear all configured contents.
Direct overwrite: Clear all original configurations first, and then add the imported configuration.
Supplemental configuration: Add imported configuration incrementally. If the original configuration and the imported configuration have the same ID or name, the imported configuration will not be used.
Real-time monitoring
System start and stop
In the system title bar, you can start or stop the system, as shown in the following figure:

The start and stop here refers to the start and stop of the entire system (including collection and upload). If you want to suspend a device or an upload service, you can operate (disable or enable) on the device monitoring and upload monitoring pages.
Equipment Monitoring
If you need to view the current collection status, you can open the device monitoring page (Data Monitoring->Device Monitoring), as shown below:
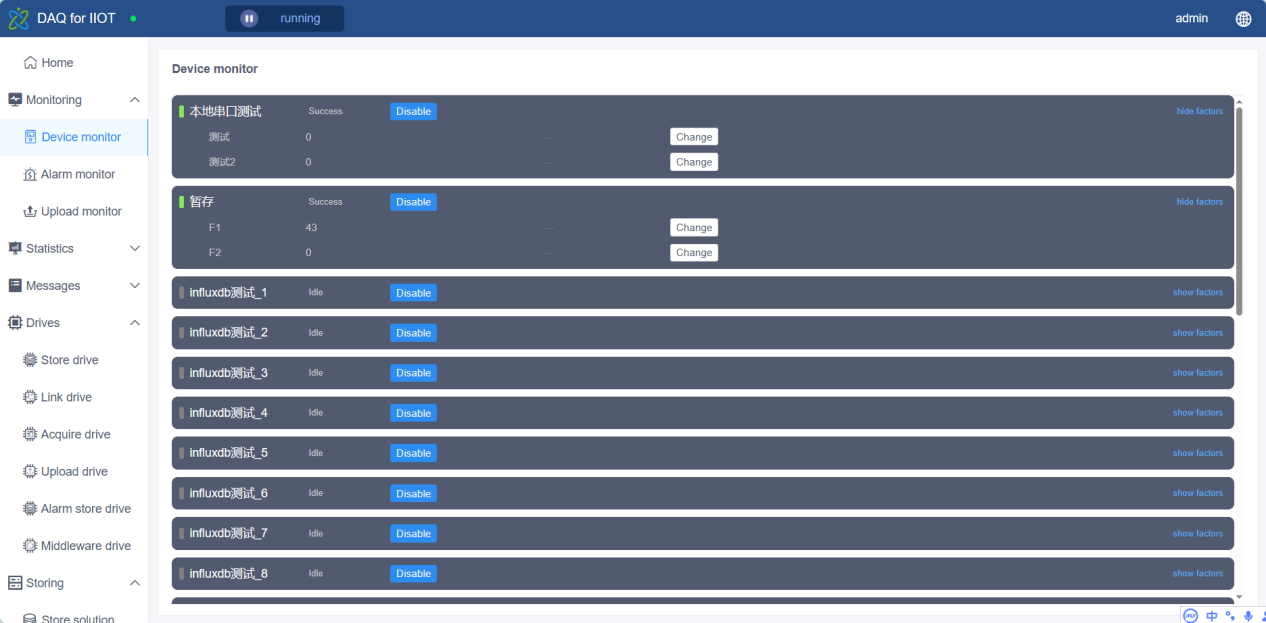
From this page, you can:
- Check the real-time status of the device. For the description of the device status, please refer to Appendix 1.
- View the real-time value of each factor, as well as the current data time.
- Enable or disable a device.
- Reverse control of the device to modify the factor value. This operation will send a change value and write command to the device , not a virtual change value.
Upload monitoring
On the upload monitoring page (Data Monitoring -> Upload Monitoring), you can view the current upload status, as shown below:
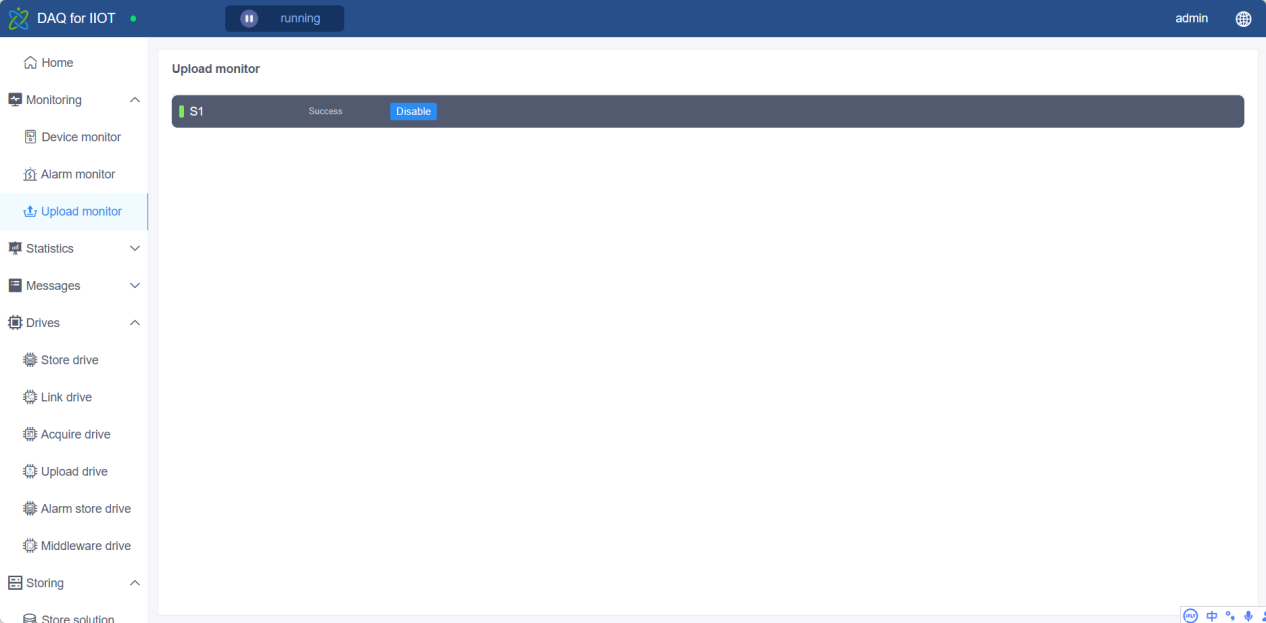
You can also pause uploading on this page.
Historical data query
Data Query
You can use tables or charts to query historical data. If you find that there is no data when querying data, the possible reasons are:
- When configuring the factor, whether to store is not checked.
- Database configuration, storage time is not to store.
- Collection was not started.
- No legitimate data has yet appeared.
Table method
The data queried using the table method is detailed data. The data query page (Statistical Analysis->Data Query) is shown in the figure below:
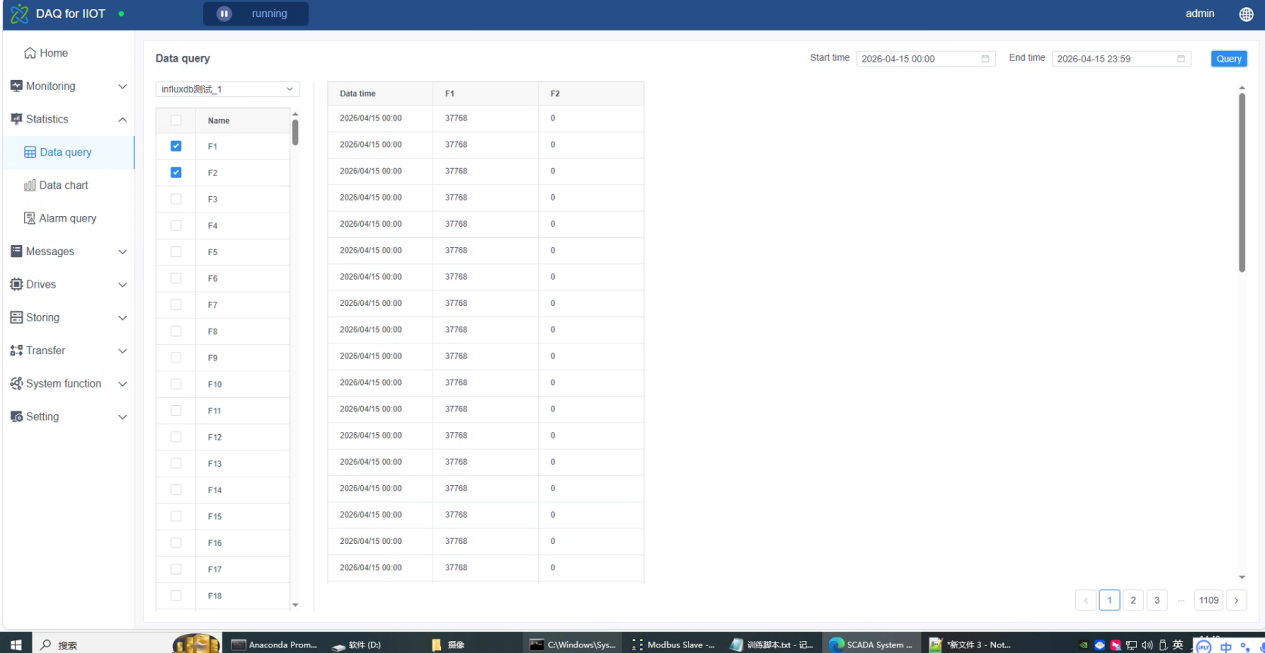
Select the factor you want to query on the left side of the page, select the start time and end time, and you can query the results.
When a sign like [Ex] appears in front of the data (or the data starts with @), it means that the data is abnormal. The data at this time is only a historical retention value and cannot be used in practice. For example, when the link is disconnected or the device is disabled, if the query result still has a value, the result at this time is meaningless. The brackets represent the device status, please refer to Appendix 1.
Chart Mode
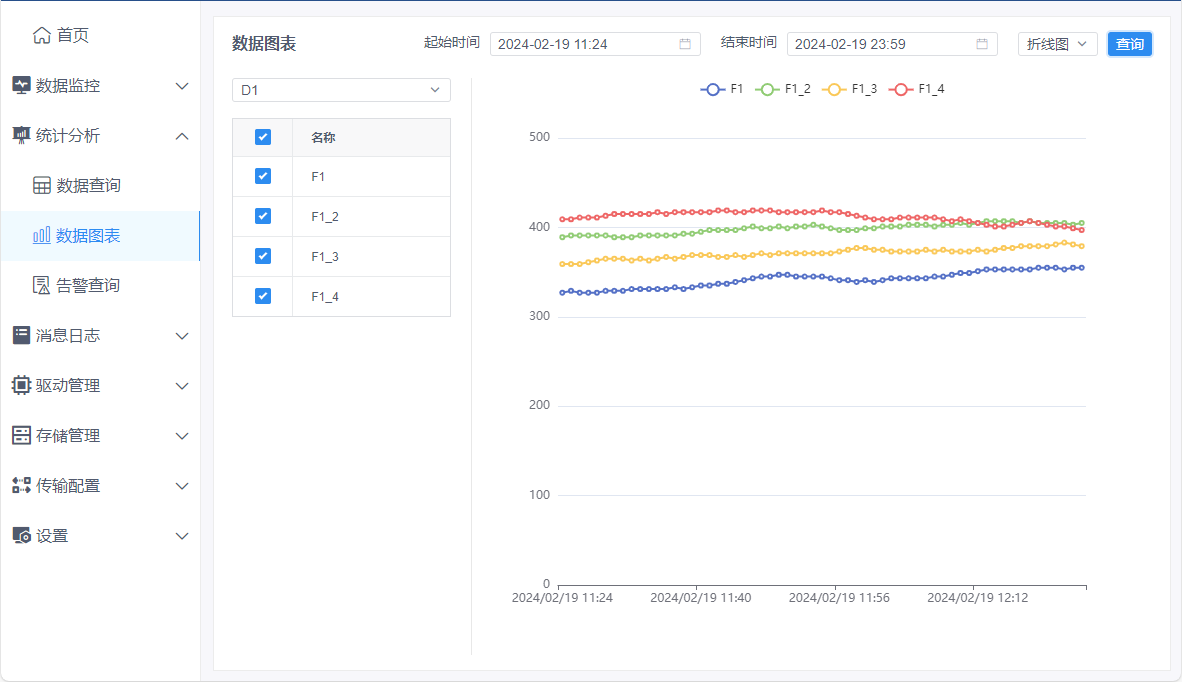
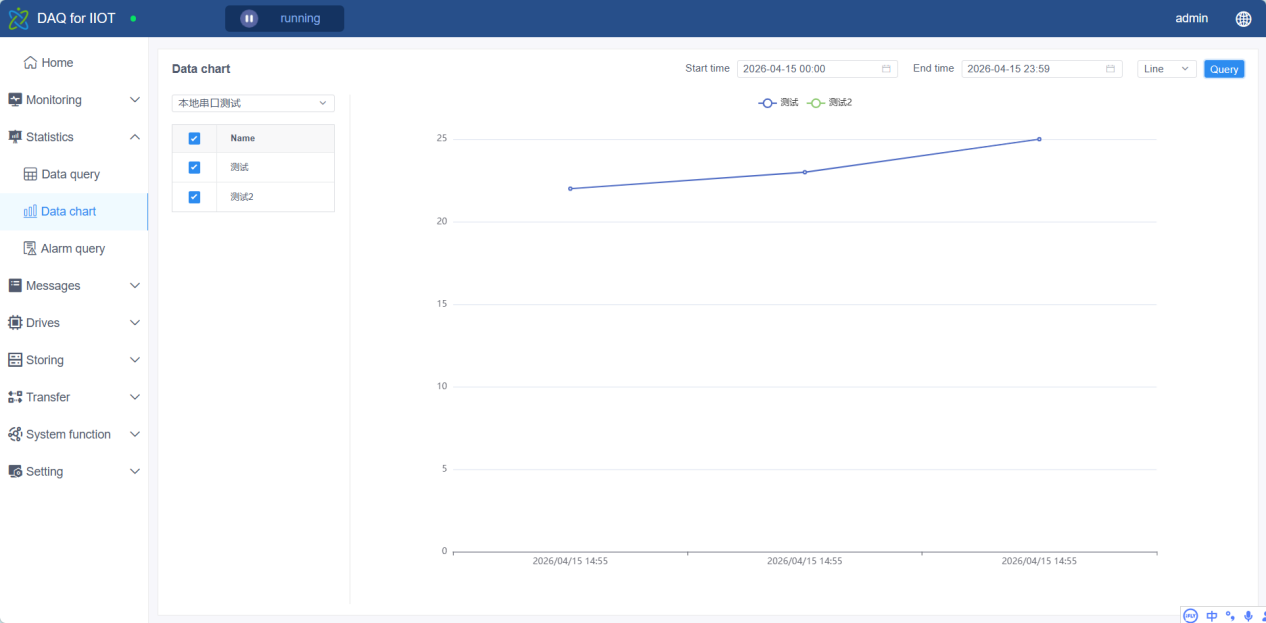
The data queried using the chart method is only brief data (when the amount of data is large, not all data will be displayed in the chart). The data chart page (Statistical Analysis->Data Chart) is shown in the figure below:
Alarm configuration and monitoring
Alarm Configuration
Configure the alarm on the alarm configuration page (Transmission Configuration -> Alarm Configuration), as shown below:
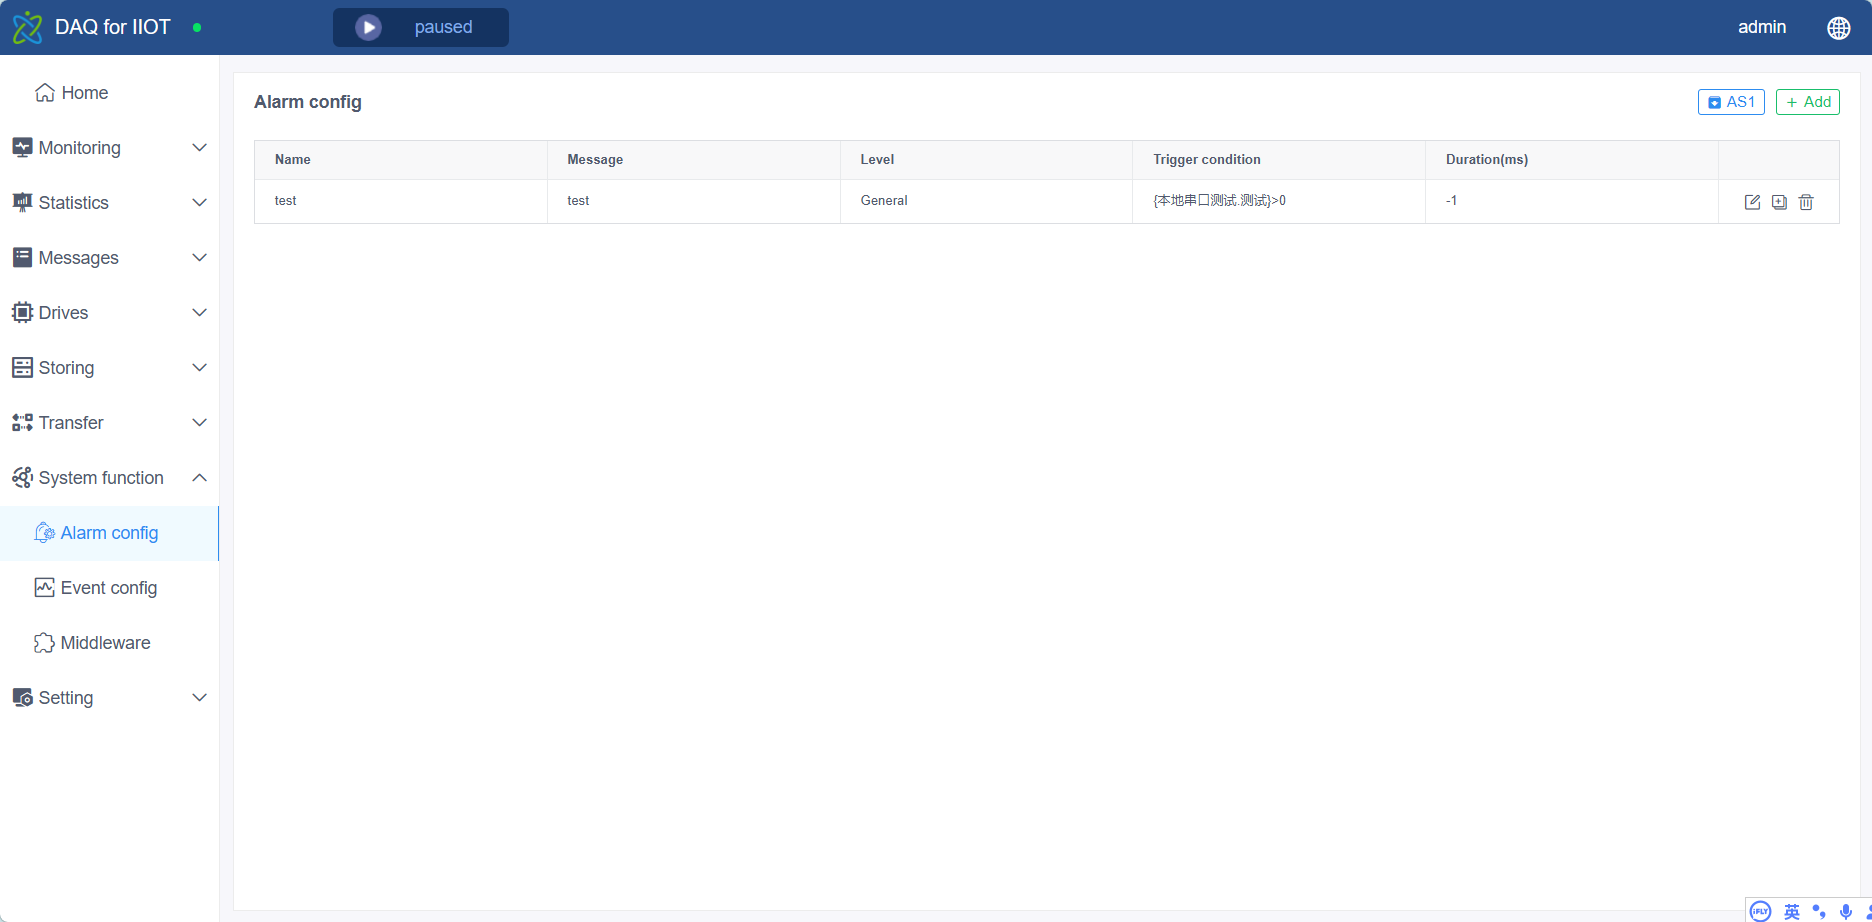
For each alarm, the configurable information includes the alarm title, alarm level, and the conditions that trigger the alarm. The expression used in the trigger condition is a logical expression, and the factors are enclosed in curly brackets. For details, please refer to Appendix 2.
Alarm storage
By default, alarm information is not stored. If storage is required, a storage plan needs to be set. Set the storage plan in the alarm storage plan setting page (Storage Management -> Alarm Storage Plan), as shown in the following figure:
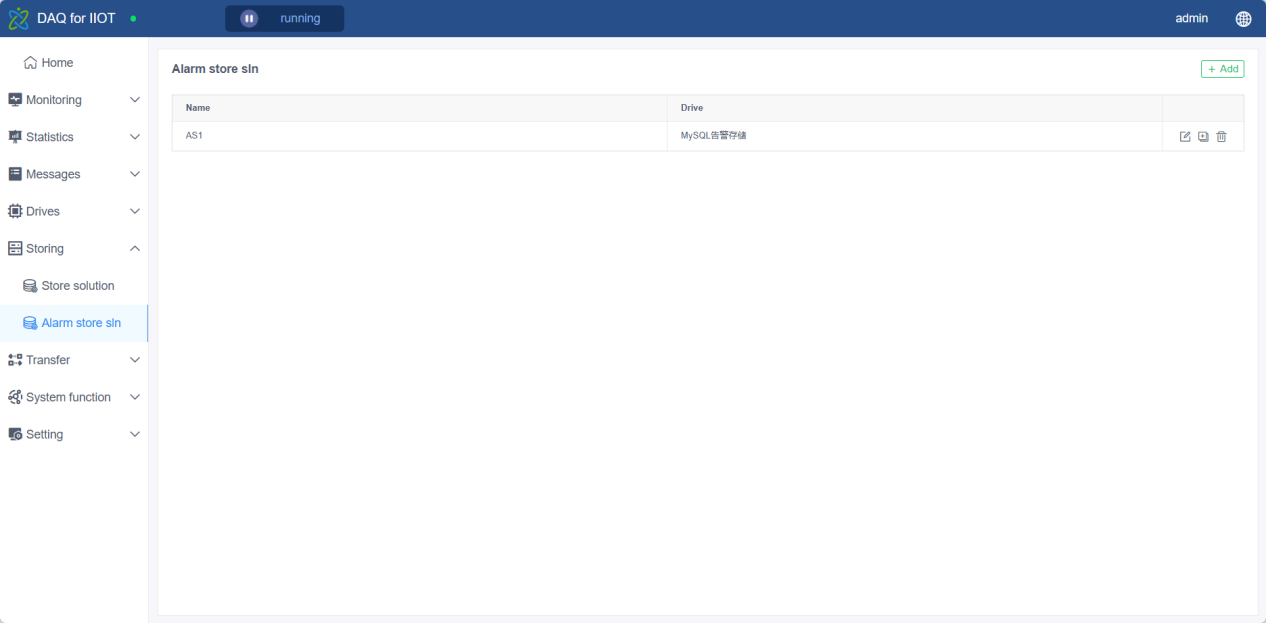
In general, you only need to fill in the connection string.
Finally, return to the alarm configuration page (Transmission Configuration -> Alarm Configuration), click the second button in the upper right corner, and select the alarm storage solution:
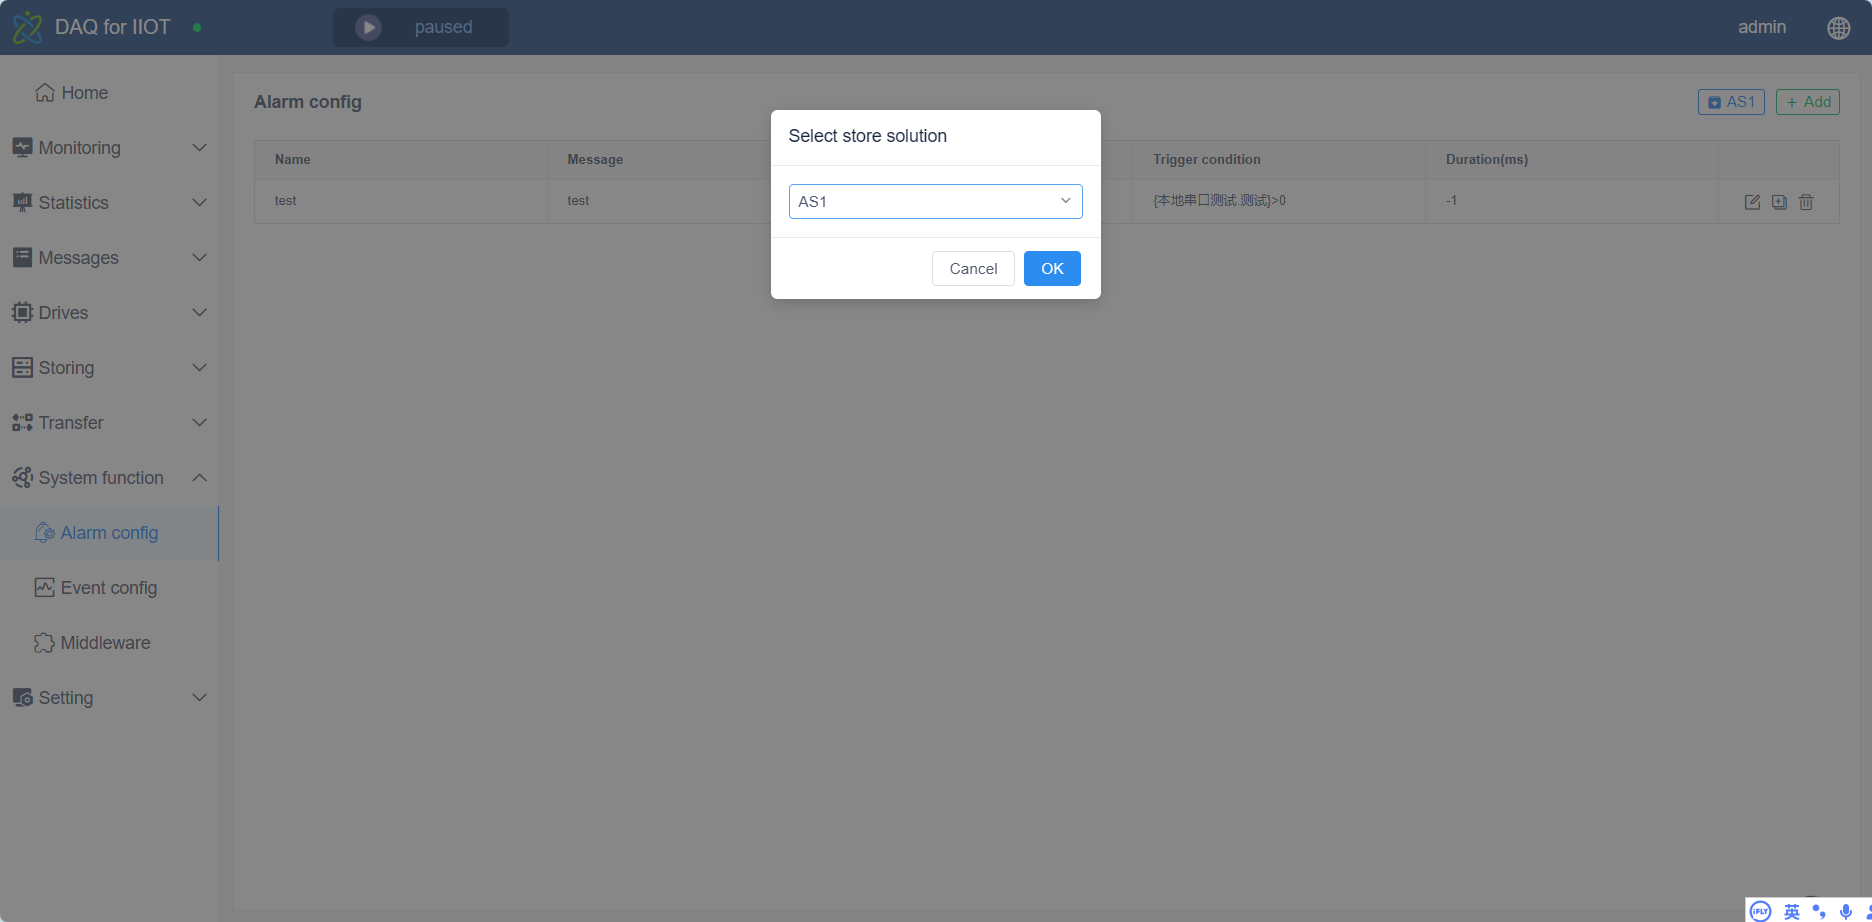
Alarm monitoring
The alarm information generated by the system in real time can be viewed in the alarm monitoring page (Data Monitoring -> Alarm Monitoring):
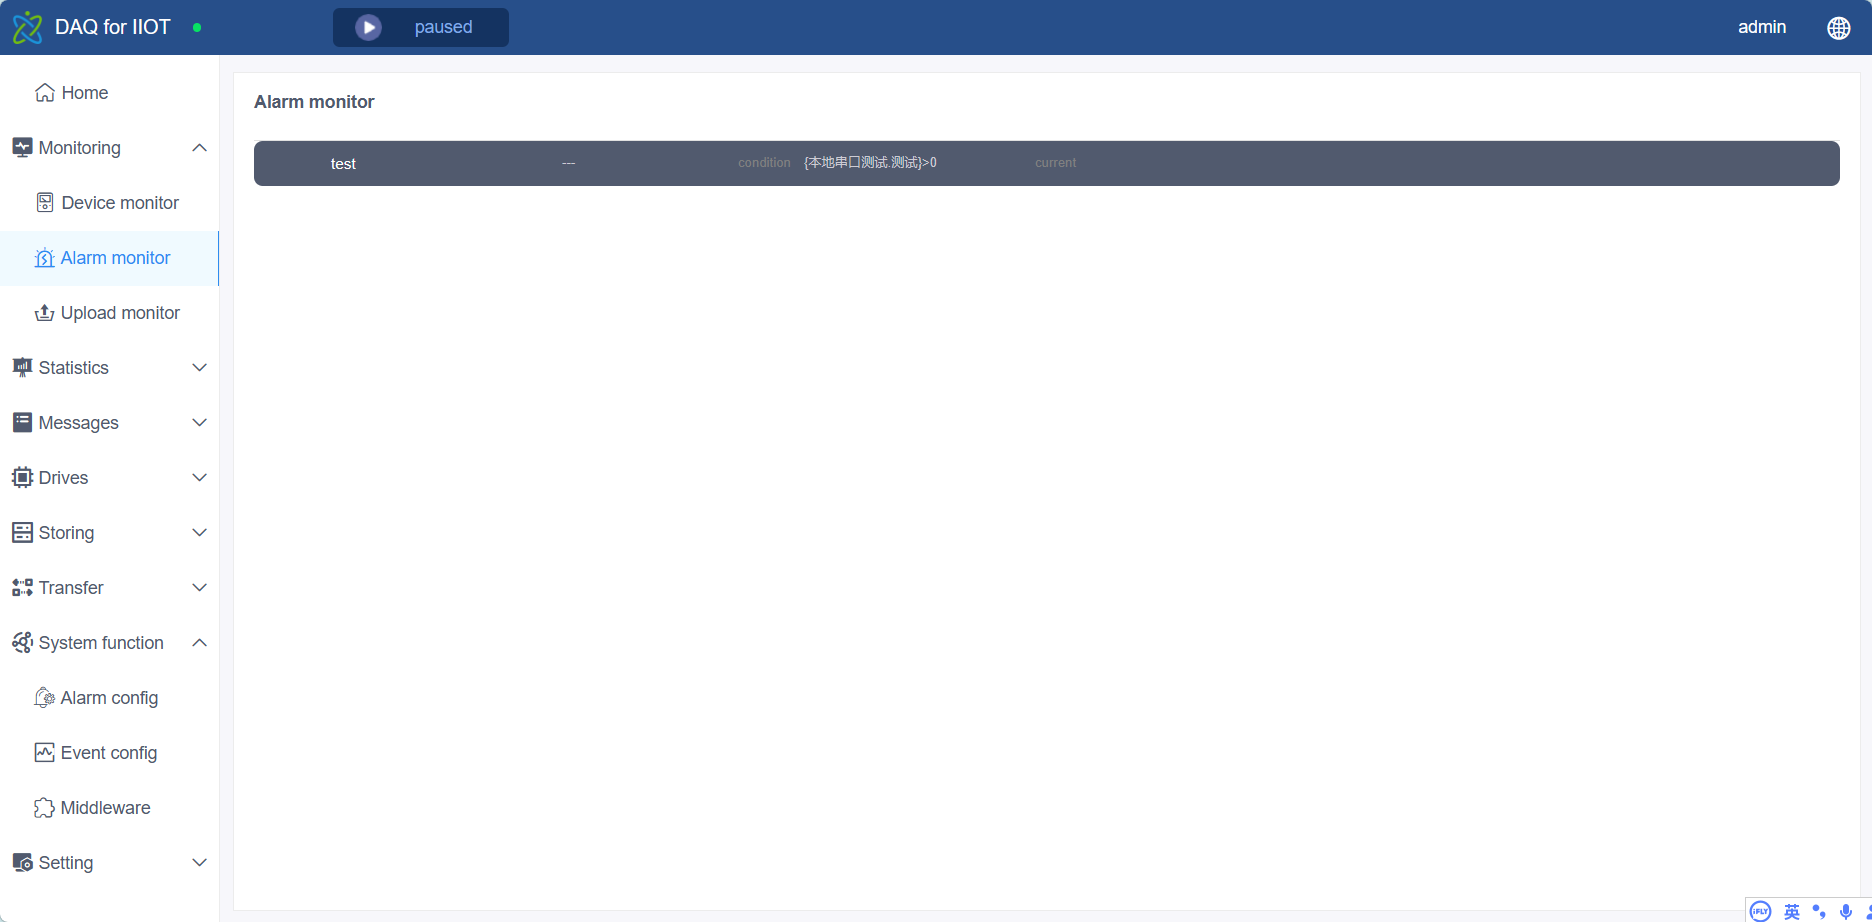
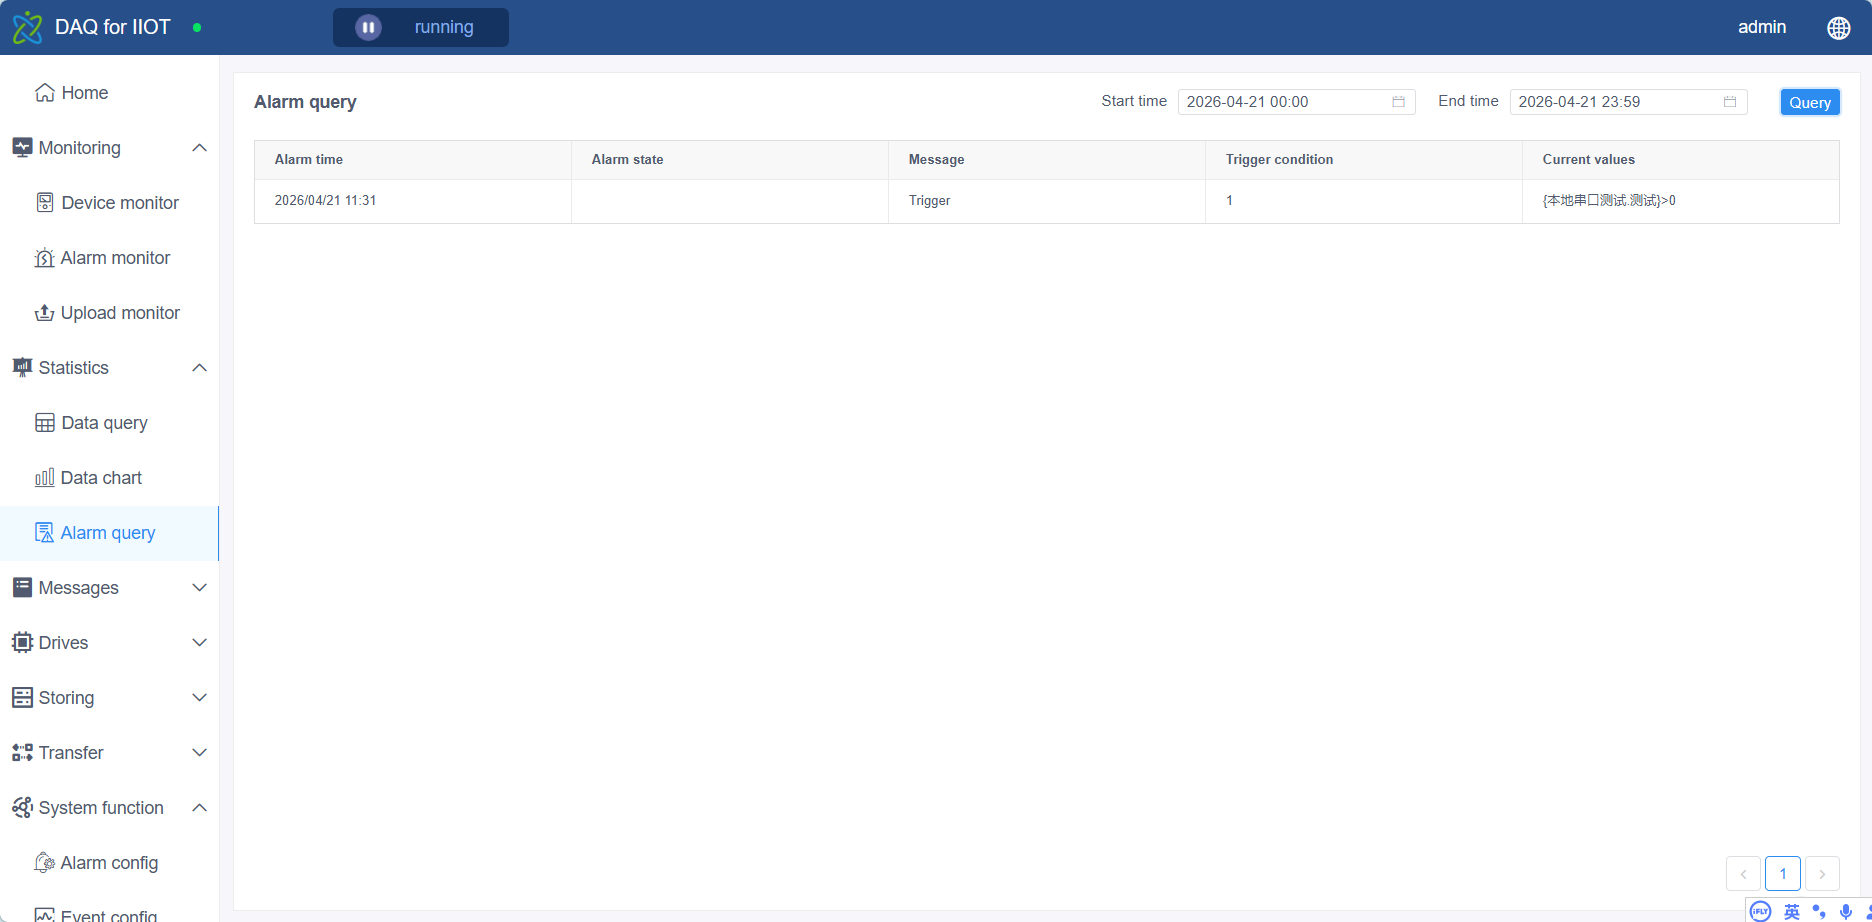
Alarm query
All alarm information generated by the system can be queried in the alarm query interface (Statistical Analysis->Alarm Query), as shown in the following figure:
User and permissions management
Default User
By default, there are two users in the system, as shown in the following table:
| account | password | Permissions |
|---|---|---|
| admin | 123456 | Super Administrator |
| super | 123456 | administrator |
After officially using the system, if permission control is required, the initial password should be modified.
User roles
The system-defined roles and their permissions are shown in the following table:
| Permissions | Visitors | Operator | Super Operator | administrator | Super Administrator |
|---|---|---|---|---|---|
| Data Query | have | have | have | have | have |
| Monitoring equipment | have | have | have | have | have |
| Control Equipment | none | have | have | have | have |
| Start-Stop System | none | none | have | have | have |
| Transport Configuration | none | none | none | have | have |
| System Configuration | none | none | none | have | have |
| User Management | none | none | none | none | have |
Configuration visualization
Functional Overview
This system provides configuration and visualization functions, with powerful low-code visualization building and orchestration capabilities, simple configuration, rich controls, and high degree of customization. Combined with data acquisition and control systems, it can realize the display of real-time and historical data, as well as real-time control of equipment.
The system supports the following functions:
- User-defined images can be added (supporting JPG, PNG, GIF, SVG and other formats).
- User-defined components can be added.
- Supports data display components such as tables and charts.
- Both real-time data and historical data can be displayed.
- Can send control commands to the device .
- Provides a large number of auxiliary design functions (auxiliary lines, rulers, magnets, alignment, etc.).
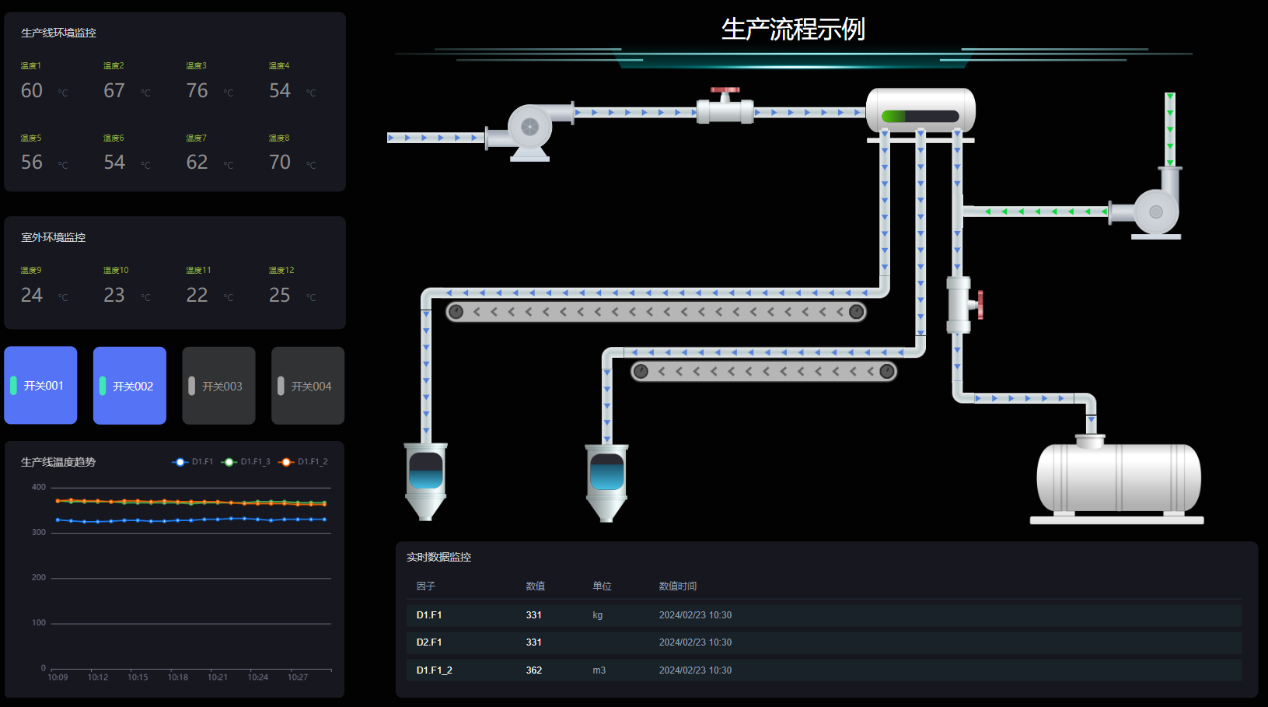
Application Examples
The following is a page designed using the visualization function:
Interface Introduction
Visual home page
The system home page is shown below:
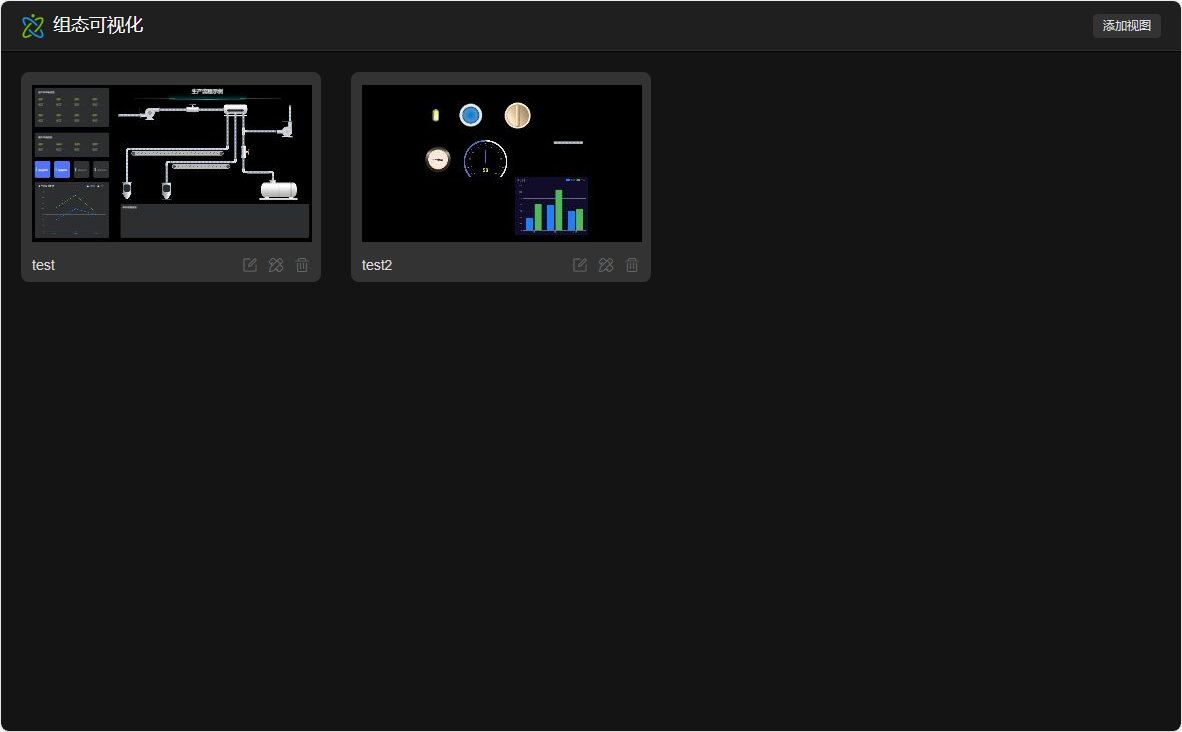
You can add multiple views to this page. For each view, click the screen to enter the running page, and click the design button in the lower right corner to design the screen.
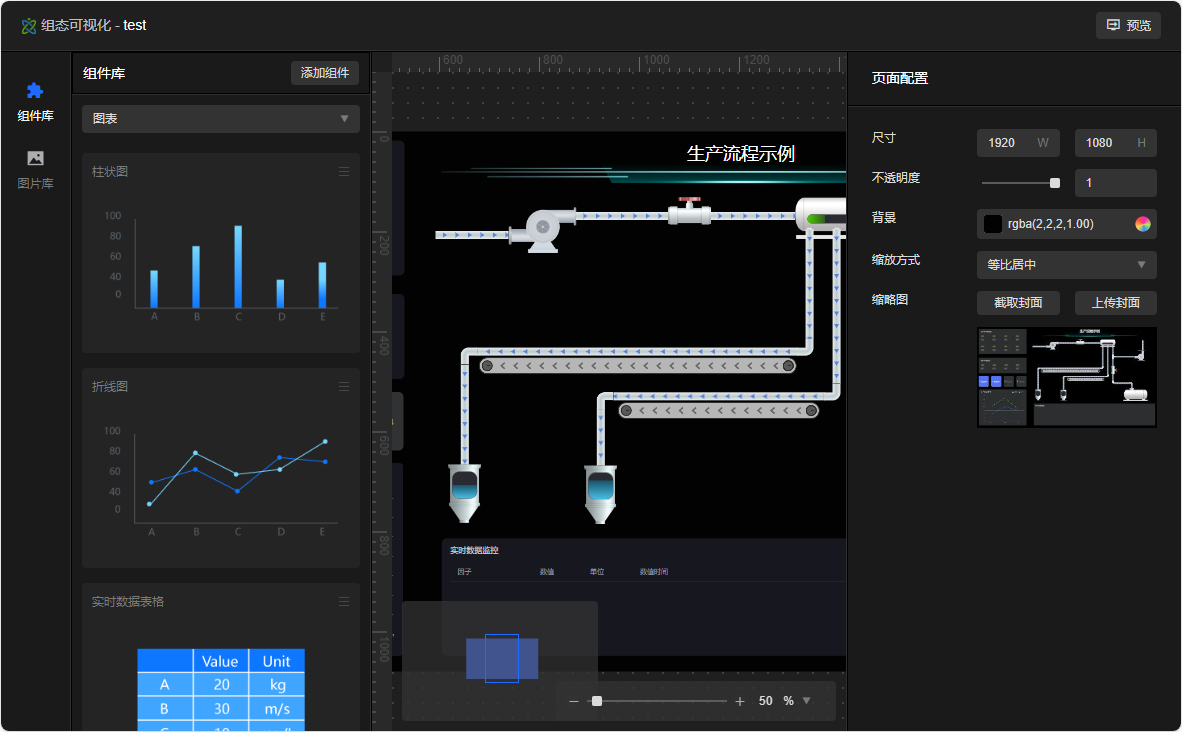
Visual design page
The system design page is shown below:
Page General Administration
At the top of the design page is the title bar. Click the view name to modify it, and click the preview button to enter the run page.
On the left side of the main part is the resource library, including the component library and image library, and you can drag resources to the main canvas.
On the right side of the main part is the property configuration panel. Selecting different elements will display the element's unique property configuration.
The center of the main part is the main canvas, where you can drag and adjust the position of resources. Below the main canvas are thumbnails and a display scale, where you can move and scale the main canvas.
General Design Steps
The general steps for designing a page are:
1. Drag assets from the asset library to the canvas.
2. Adjust the size and location of resources.
3. Modify the resource's style, data source, and trigger events.
Resource Library
The system's resource library includes two types: component library and image library.
The elements in the picture library are just simple pictures. Users can upload custom pictures. Supported formats include png , jpg, gif , svg , etc.
The elements in the component library contain code functions and can provide richer interactive functions, such as charts, progress bars, input boxes, etc. Users can also develop components according to the development documents and then upload them to the system for use.
Resource attributes
Different types of resources have different properties, such as rectangles have corner radius properties, pipes have flow shape properties. However, the properties of all resources can be divided into three parts: style, database, and event.
The style part includes information such as size, position, color, font, etc.
The data source part defines how the resource changes dynamically, and completes the function by filling in expressions. For example, after filling in an expression like {D1.F1}==1 in the display condition, the resource will be displayed when D1.F1 is 1, and hidden in other cases. For another example, for text, after filling in an expression like current value: {D1.F1}, the resource will display the following text when D1.F1 is 1: Current value: 1.
The event part defines what happens after some operations are performed on the resource on the running page. For example, if you fill in {D1.F1}=2 in the click event, then after the user clicks the resource, the system will send a command to the device to change the value to 2. For another example, if you fill in <var1>=value in the input box change value event , when the user enters 12.5 in the input box, the value of the variable var1 will change to 12.5.
Visual operation page
The running page only contains the designed content and no additional page elements, as shown in the following figure:
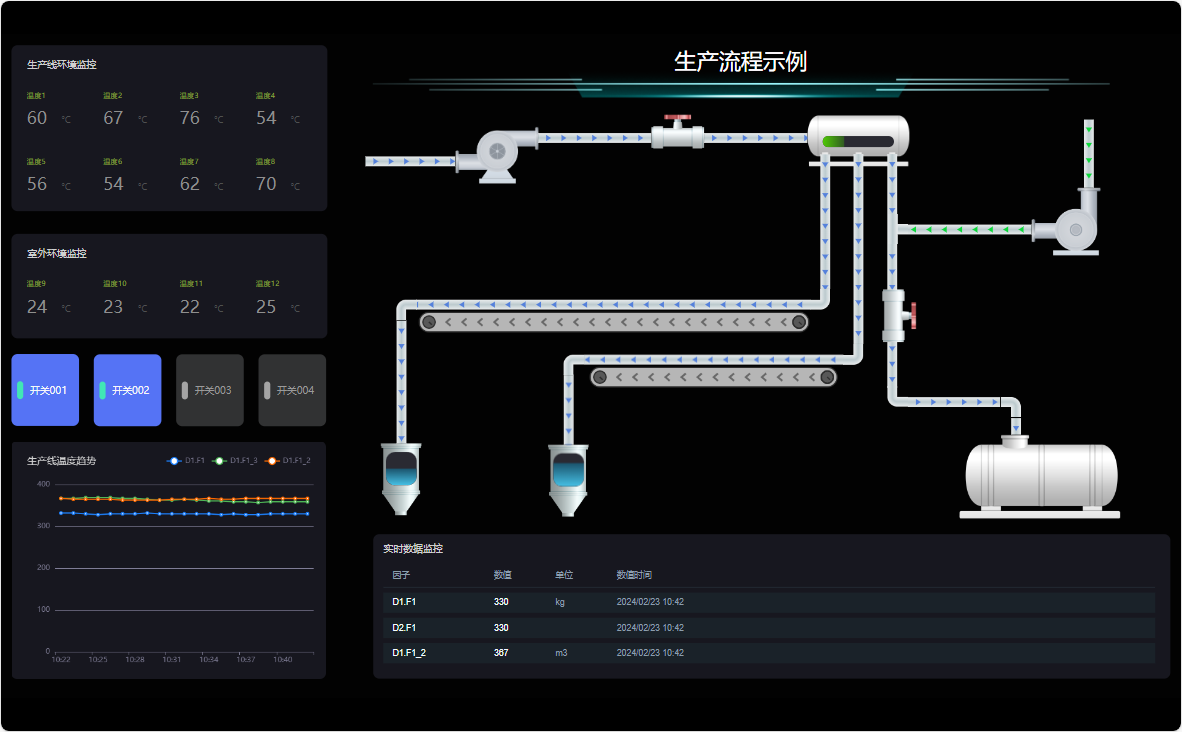
On the Run page, available functions include:
- Displays the device values collected in real time.
- Displays data history.
- Display dynamically changing system processes.
- Send instructions and values to the device by operating page elements .
- Switch to a different view page.
Data Source
Data Citation
To reference a factor in a data source, enclose the factor name in parentheses. The expression is:
| {Device name.Factor name} |
|---|
To reference a temporary variable in a data source, add angle brackets around the variable name. The expression is:
| <variable name> |
|---|
Text data source
Text data sources can be written normally, and where data needs to be referenced, just insert a reference expression. For example:
| The current measured value is: {D1.F1} mg/L |
|---|
Conditional Data Sources
The conditional data source requires the written content to be a logical expression, such as:
| {D1.F1}>=10 && { D1.F2}< =30 |
|---|
Chart Data
The format for reading factor data is:
| factor|factors|minutes|interval|format |
|---|
The first factor is a fixed string.
factors is a list of factor names separated by commas, such as D1.F1,D1.F2.
Minutes is the number of minutes of data to be retrieved .
Interval is the interval in minutes between each piece of data.
format is the time display format. The year, month, day, hour and minute are represented by yyyy , MM, dd, HH and mm respectively.
Here is an example. Take the data of D1.F1 and D3.F1, take one piece of data every 5 minutes within one hour, and the time display format is HH:mm , then the content to be filled in is:
| factor|D1.F 1,D 3.F1|60|5|HH:mm |
|---|
event
Event Overview
Each event can contain multiple instructions, separated by semicolons, such as:
| Instruction 1; Instruction 2; Instruction 3 |
|---|
Instruction types include modifying factors, modifying variables, switching pages, etc.
Modify Factor Event
The format of a modifier event is:
| {Device name.Factor name}=value |
|---|
Other, the value can be a fixed number or a variable, such as:
| { D1.F1}= <var1> |
|---|
Value Change Event
Some controls (such as input boxes) have value modification events. When the event occurs, use value to refer to the newly modified value. The format is:
| Factor or variable = value |
|---|
Here is an example to implement such a function: add an input box and a button to the view, and when the button is clicked, the value of the input box is sent to the factor D1.F1. To complete such a function, enter the following in the input value change event:
| <var1>=value |
|---|
Then in the button's click event enter:
| { D1.F1}= <var1> |
|---|
Page switching events
The format of the page switching event is:
| page=page name[,new] |
|---|
If you want to replace the current page, the command is:
| page=page name |
|---|
If you want to open a new page, add "new" after the command, as shown below:
| page=page name,new |
|---|
Appendix 1 Equipment Status Codes
The device status codes and their meanings are shown in the following table:
| Code | Representative significance | Cause |
|---|---|---|
| 0 | idle | |
| 1 | success | |
| 2 | Disable | |
| 3 | No data collection required | The device has no factors configured. |
| -1 | Link Error | Link opening error, link disconnection, unable to send data, authentication failure. |
| -2 | no reply | No response was received after sending data. If everything is normal, it is possible that the receiving wait time is set too short. |
| -3 | Data Error | Parsing error after receiving data. If everything is normal, it is possible that the communication protocol does not correspond or the configuration is wrong. |
| -9 | Unknown error |
Appendix 2 Data Sources and Expressions
A2.1 Variable reference
In device configuration, hardware is read and written by configuring a factor. Where expressions are used, this factor refers to the corresponding hardware. Use device name.factor name to represent factors.
For example, a device D1 using the Modbus protocol is added, and a factor F1 is added to read and write the value of register address 40001. Then, D1.F1 represents register 40001.
In expressions, variables need to be written in curly braces:
| {Device name.Factor name} |
|---|
To reference itself, you can use this:
| {this} |
|---|
A2.2 Expression Types
There are four expressions used in the system, namely:
Numeric expression: The result of the calculation is a numeric value, for example: {a}*2.5+3
Logical expression: The result of the calculation is a logical value, for example: {a}>10
Text expression: can only calculate the content in the braces, there is no fixed format, for example: the value of a is {a}mg/L
Command expression: There is an equal sign in the middle, the variable is on the left, and the value is on the right, for example: {a}=10
A2.3 Factor configuration expression
In the factor configuration, you can enter an expression. This is generally used when there is a functional relationship between the collected value and the actual displayed value. For example, the collected value is in kg, but the storage requirement is in g. Then, after this value is collected, an expression needs to be used for conversion.
The factor configuration expression is a numerical expression. Taking the above example, assuming the factor is D1.F1, the actual factor needs to be multiplied by 1000. The expression can be written as:
| { D1.F1 }* 1000 |
|---|
Since the factor filled in the expression is the current factor, you can also use this instead, as follows:
| {this}*1000 |
|---|
When the expression is simply multiplied by a factor, or a bias value is added (can only be multiplied or added), it can be abbreviated directly to:
| *1000 |
|---|
or
| +10 |
|---|
Appendix 3 MODBUS Configuration Instructions
A3.1 Driver and Link Selection
There are three types of Modbus protocols, namely Modbus-RTU, Modbus-TCP and Modbus-ASCII. You need to select the appropriate acquisition driver according to the actual situation. All three communication protocols can communicate under TCP client or serial port link.
A3.2 Collection interval selection
For Modbus communication protocol, the acquisition interval and cycle wait can be set to 0, and the receiving wait time needs to be more than 100ms. If you find that the data is chaotic when receiving data, it is generally caused by insufficient receiving wait time. If this problem occurs, you can increase the receiving wait time appropriately. If you want to know the more accurate time, you can send a Modbus command to the device and observe the time of data reply.
A3.3 Storage Mode
The Modbus protocol defines a variety of data storage spaces, including registers, coils, input registers, and input coils. The storage mode to be used is selected according to the document description.
A3.4 Channel Type
For registers, the channel types are various, including FLOAT, INT, BIT, etc.; while for coils, the channel type is only BIT.
For multi-byte data, the storage order of bytes in different devices may be different, so you need to choose according to the actual situation. The following are commonly used byte orders:
| Data Types | Common byte order |
|---|---|
| FLOAT | FLOAT1032 |
| INT | INT1032 |
| Unsigned | Unsigned10 |
| Signed | Unsigned10 |
A3.5 Bitwise Value
Select register for storage mode and BIT for channel type, then you can get the value by bit. The starting address is the address of the register, and the bit address indicates which bit of data to get. The bit address is from right to left, that is, the rightmost bit is bit 0.
A3.6 Continuous Addresses
If there are several factor channels of the same type and with consecutive addresses, they can be configured once. Just fill in a value greater than 1 in the channel number, and the automatically created factor address will be automatically adjusted according to the channel type. The following is an example after the channel number is filled in with 5:
| Storage Mode | Channel Type | Starting address | Bit Address | Generate Address |
|---|---|---|---|---|
| register | Signed10 | 0 | / | 0 1 2 3 4 |
| register | FLOAT1032 | 0 | / | 0 2 4 6 8 |
| Coil | BIT | 0 | / | 0 1 2 3 4 |
| register | BIT | 0 | 13 | 0.13 0.14 0.15 1.0 1.1 |